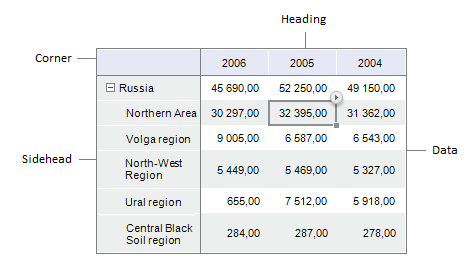
A table visualizer is a spreadsheet built based on a multidimensional report data source.
A table consists of several basic elements, each of these elements having specific settings.
Table elements:

Corner is the top left cell in the table that enables the user to show dimension names in rows and columns.
Sidehead is the table element that shows names of dimension elements located in rows.
Heading is the table element that displays names of dimension elements located in columns.
Data is the table element that consists of data cells.
To apply settings to one of the table elements, select this element.
NOTE. On selecting a table element the Table group of tabs on the side panel is renamed according to the selected element: if table heading or sidehead is selected, the tab is named Heading, when the corner is selected, it is named Corner, and when the data is selected, the tab is named Data.
 Set up general table parameters
 Work with dimension elements in table
See also:
Getting Started with the Reports Tool in the Web Application | Data Area | Relational Data Area | Formula Area | Advanced Analytics | Building Report | Working with Ready Report