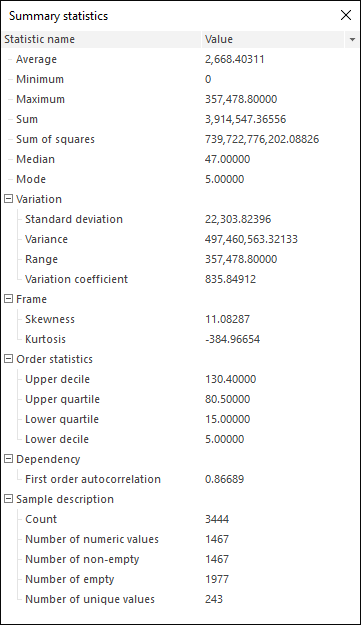
Summary Statistics
Data table displays summary statistics calculated for selected table ranges. A set of calculated statistics depends on values in the selected range.
Summary statistics can be displayed:
In a status bar. It enables the user to calculate basic aggregates for the selected cell range. The option is available only in the desktop application.
In a separate window. It enables the user to calculate entire set of summary statistics. The option is available in the Analytical Queries (OLAP) and Dashboards tools.
To display summary statistics in a separate window:
Select part of the table, for which it is necessary to display statistics. If one data cell is selected, summary statistics will be calculated for the entire table.
Select the Summary Statistics context menu item or click the  Summary Statistics button on the Data ribbon tab.
Statistics for the selected range will be displayed in the Summary Statistics dialog box:

For detailed description of calculated statistics see the Library of Methods and Models section.
See also:
Table Data Analysis
 Summary Statistics button on the Data ribbon tab.