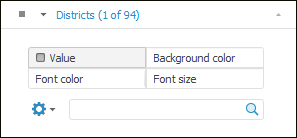
Table data can be displayed by four metrics:
Value.
Background color.
Font color.
Font size.
IMPORTANT. The Background Color metric can be overlapped with condition formatting of data in the table.
When the Background Color, Font Color, Font Size metrics are displayed, metrics legend can be set up.
To set up data displaying in table by several metrics:
In the Selection tab group on the side panel select a fixed dimension, which element values are displayed in table cells.
Select the Metrics item in the menu of the selected dimension tab. The tab shows the radio buttons Value, Background Color, Font Color and Font Size.
Select the required radio button and select the dimension element, which value will be displayed by the selected metric. The dimension with a metric role always has only a single selection available.
NOTE. Take into account the following feature of scales used for metrics: border values are always included into smaller scale interval. For example, there is a scale with three intervals: less than 25, from 25 to 50, greater than 50. The 25 value will be in the Less Than 25 interval, the 50 value will be in the From 25 To 50 interval.
The example of table with displaying of data by different metrics:
See also:
Working with Data Table Dimensions