A data series is a chart component that is a data array. A chart is based on a set of data series.
Data series are shown graphically on the chart, for example, as a set of colored columns.
The chart data series, for which name is defined, is marked with a single color and the icon specified in the legend.
NOTE. By default, no more than 99 series can be displayed on a chart. If the greater number of series is selected, the first 99 series is displayed, the rest is hidden. To change the maximum number of series displayed on a chart, use registry settings.
See below examples of series for various chart types:
The following approaches are used to set up data series:
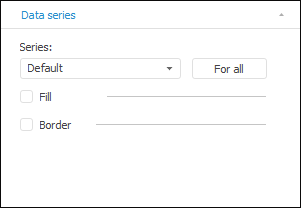
The Data Series tab is located on the side panel and is used to set up data series format.
NOTE. The number of displayed settings depends on the chart or series type.
On initial chart setup, the Default series is selected on the tab. This series is not displayed in the legend and enables the user to determine settings, which are applied for all existing series and for new added series. A waterfall chart displays the series, for which it was built.
 Settings available for the Default series
To set up a particular series, select it in the drop-down list in the beginning of the tab and to set up all series, select the Default series. Note that settings determined for the Default series do not overlap settings determined manually for a particular series.
To apply the Default series settings for all series, including series with custom settings, click the For All button.
Tab type, if a specific series is selected:
The following actions are available for all chart types:
Save data series format settings
Set up data series display in the chart plot area
Features that are available depending on the chart type:
Show markers for series points
Change visibility of connecting lines
Functionalities available only in the web application:
Animation on data series rendering
See also:
Setting Up General Chart Parameters | Setting Up Chart Components | Chart Types