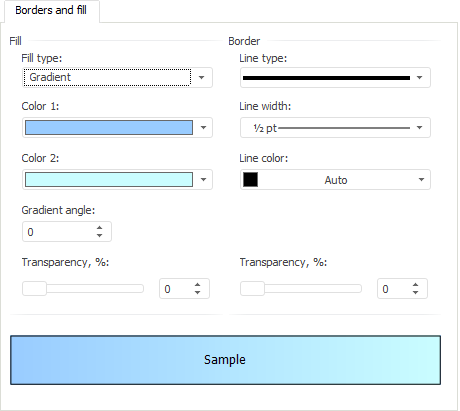
The Borders and Fill tab can be used to set up borders and fill for the following chart components:
Chart area in the Chart Area Format dialog box.
Plot area in the Plot Area Format dialog box.
Chart caption in the Caption Format dialog box.
Data series in the Data Series Format dialog box.
Data labels in the Label Format dialog box.
Chart legend in the Legend Format dialog box.
NOTE. Dialog boxes can be used to set up borders and fill of chart components only in the desktop application.
The Borders and Fill tab looks as follows:

NOTE. The set of options on the tab may differ for different components.
The following operations for component formatting setup are available on the tab:
 Set up fill and borders transparency
The Sample area shows how the component will look like after the specified parameters are applied. Check if the component appearance corresponds to the expected result.
See also:
Chart Area | Captions | Legend | Setting Up General Chart Parameters | Setting Up Chart Components