 To display the tab
A plot area is part of chart area, on which data series are located.
The following methods are used to set up parameters of chart plot area: quick and advanced setup.
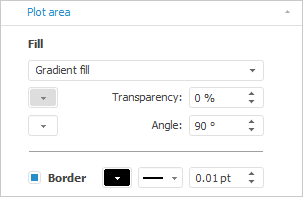
To quickly set up chart plot area parameters, use the Plot Area side panel tab.
The setting is available for all chart types except for pie, doughnut, radar charts, secondary histogram and secondary pie chart.

The following operations are available on the tab:
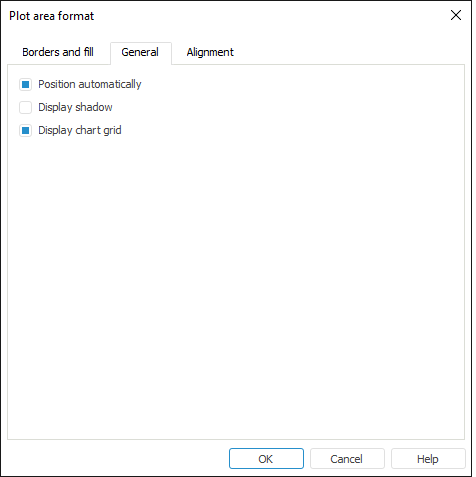
To execute advanced setup of plot area formatting parameters, use the Plot Area Format dialog box.
NOTE. Chart plot area can be set up using the Plot Area Format dialog box only in the desktop application.
 To open the Plot Area Format dialog box

The following operations are available to set up chart plot area:
See also:
Setting Up General Chart Parameters | Setting Up Chart Components