A histogram presents changes in data for particular period of time and shows object comparison.
Histogram shows value of each element as a horizontal or vertical column, which length is proportional to the element value. Each data group has individual set of columns on the chart, each data series is marked with specific color specified in the legend.
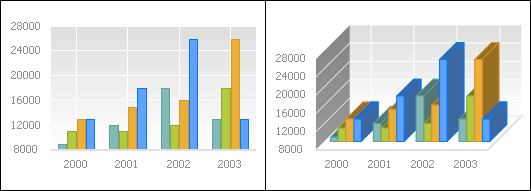
Example of histogram (regular and 3D):
The following chart parameters can also be changed in the edit mode:
Additional parameters setup is available for this chart type.
See also:
Chart Types | Setting Up General Chart Parameters | Setting Up Chart Components