Histograms with fluctuation intervals are used to show data that contains fluctuation intervals. Similar to stock exchange chart with four series with volume, the difference is in:
Ability to determine shifting for each fluctuation interval towards column center.
Ability to increase the number of used series.
Ability to display additional series on the secondary axis.
NOTE. The first four series are built on the primary axis.
Use of the size of the same order that the rest series instead of the volume.
NOTE. Source data should be represented by positive numbers.
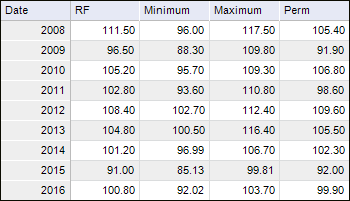
To create a histogram with fluctuation intervals, correctly arrange output data. Four series must be set as the source data:
1st series. Value of the factor, towards which the fluctuation occurs.
2nd series. Minimum factor value.
3rd series. Maximum factor value.
4th series. Current factor value.
To show the example of the histogram with fluctuation intervals, use the Real Average Monthly Salary of Employees, in % to the Previous Year source data:
The example of displaying a histogram with fluctuations:
The following chart parameters can also be changed in the edit mode:
Additional parameters can be set up for this chart type.
See also:
Chart Types | Setting Up General Chart Parameters | Setting Up Chart Components