TIP. To quickly set up series format, use the Data Series tab of the side panel.
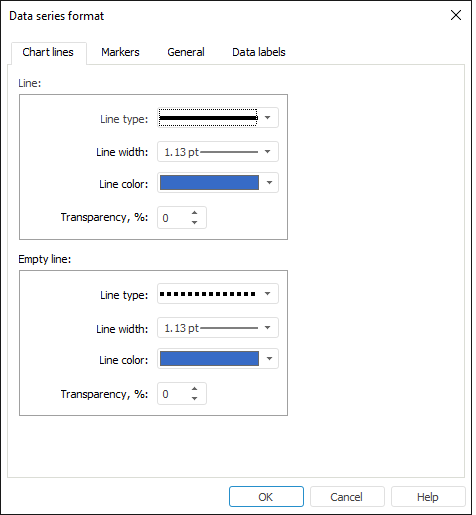
To set up chart lines, go to the Chart Lines tab of the Data Series Format dialog box. The setting is available for linear, scatter, and stock exchange charts and for the Line series in mixed, radar and stepped charts.
NOTE. Chart lines can be set up using the Data Series Format dialog box only in the desktop application.
TIP. To quickly set up series format, use the Data Series tab of the side panel.

The tab can be used to determine formatting settings of a line and empty line.
An empty line is used if the chart contains no values. In this case two nearest available values on the chart are connected with a line that has specified settings.
A line and empty line have the same settings:
See also:
Data Series | Setting Up General Chart Parameters | Setting Up Chart Components