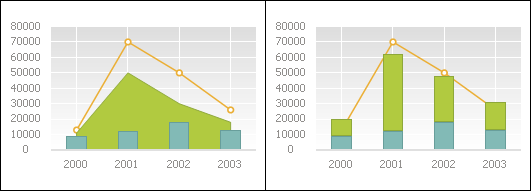
A mixed chart enables the user to determine an individual chart type (columns, lines, or areas) for each data group. For example, it is possible to combine the chart containing data about prices with histogram showing volume of sales.
For details about setting up of data series type see the Data Series section.
Examples of mixed chart (regular and stacked):

The following chart parameters can be changed in the edit mode:
Additional parameters setup is available for this chart type.
See also:
Chart Types | Setting Up General Chart Parameters | Setting Up Chart Components