A line chart shows data changes in time on a general scale. It is suitable for showing trends of data change with equal intervals.
A line chart shows each data element as a point, the vertical coordinate of which is proportional to the element value. If there are several data groups, the points corresponding to one data series are connected with a broken line.
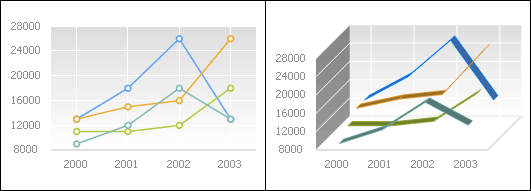
Examples of line charts (regular and 3D):
The following chart parameters can also be changed in the edit mode:
See also:
Chart Types | Setting Up General Chart Parameters | Setting Up Chart Components | Chart Corridors