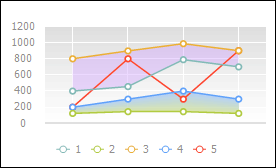
A chart corridor is a selected part of the plot area positioned between two rows of a line chart. Multiple corridors can be created.
A corridor with a solid fill (top) and a gradient fill (bottom) looks as follows:

The Time Series Analysis and Modeling and Forecasting tools (in the web application) enable the user to quickly add a corridor to a chart. To add a corridor, click the ![]() Chart Corridors button on the Chart ribbon tab. The corridor is added between the forecasting series and confidence limits. The corridor is displayed if the forecasting series and confidence limit series are present on the chart. The Modeling and Forecasting tool in the desktop application enables the user to add corridors automatically to a chart.
Chart Corridors button on the Chart ribbon tab. The corridor is added between the forecasting series and confidence limits. The corridor is displayed if the forecasting series and confidence limit series are present on the chart. The Modeling and Forecasting tool in the desktop application enables the user to add corridors automatically to a chart.
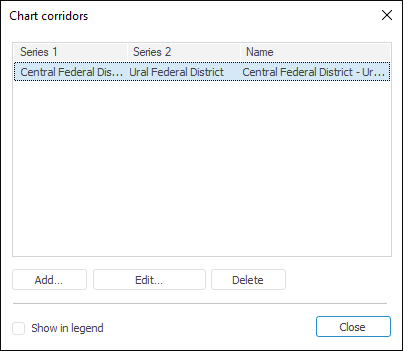
To set up chart corridors, use the Chart Corridors dialog box.
NOTE. Chart corridors can be set up only for line charts and only in the desktop application. The corridors added to chart in the desktop application, also are visible in the web application.

The following operations are available in the Chart Corridors dialog box:
The list contains all the corridors determined on the chart. One or several corridors can be selected (hold down the CTRL key for multiple selection).
See also:
Data Series | Line Chart | Setting Up General Chart Parameters | Setting Up Chart Components