 To open the Chart Corridor Properties dialog box
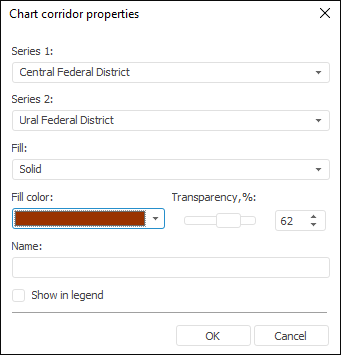
To create and edit a chart corridor, use the Chart Corridor Properties dialog box.
NOTE. Chart corridors can be set up only for line charts and only in the desktop application.
 To open the Chart Corridor Properties dialog box

To set up chart corridor:
In the Series 1 and Series 2 lists select the series, between which a corridor should be created.
Select type of chart corridor fill in the Fill drop-down list:
Solid. Solid fill will be used to color chart corridor. Select fill color in the drop-down palette or select a new color in the advanced color palette that opens on clicking the Other button.
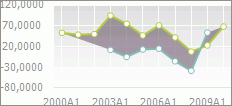
Gradient. Gradient fill with smooth color transition will be used to color chart corridor (data series colors are used). Gradient fill is used if series, between which the corridor is set, do not have missing data. If series contain missing data, the corridor is filled with grey. For example:

If required, set transparency of chart corridor fill.
Set the corridor name to be displayed in the internal or external chart legend. The following name is used by default: Series 1 name – Series 2 name.
To show chart corridor in internal or external chart legends, select the Show in Legend checkbox.
See also:
Chart Corridor | Setting Up General Chart Parameters | Setting Up Chart Components