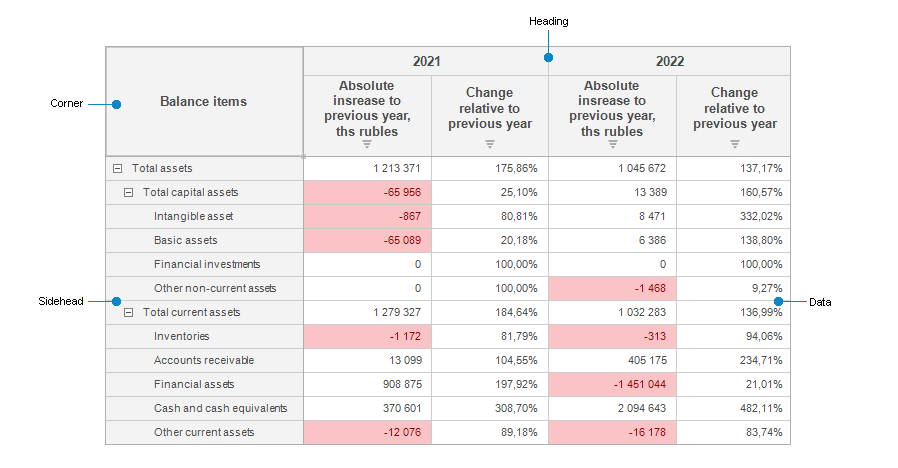
A data table is a spreadsheet built on a data source, and is used in the following tools of Foresight Analytics Platform: Analytics Queries (OLAP),Dashboards,Reports, Time Series Analysis.
Data table structure consists of several main elements, each of them has its own settings:

Table elements:
Corner. The top left cell of the table that enables the user to show dimension names in rows and columns.
Sidehead. The table element that shows names of dimension elements located in rows.
Heading. The table element that shows names of dimension elements located in columns.
Data. The table element that consists of data cells.
To set up one of table elements, select it.
NOTE. On selecting a table element the Table group of tabs on the side panel is renamed according to the selected element: if table heading or sidehead is selected, the tab is named Heading, when the corner is selected, it is named Corner, and when the data is selected, the tab is named Data.
See also: