
 Create a visualizer
Tool interfaces in the web application and in the desktop application are identical, and differences in functionality are given in appropriate comments.
Dashboard visualizers are used to display information from data sources with the ability to analyze and set up displayed data. Available visualizers:
Table. It displays table data.
Chart. It displays data as graphs.
Map. It displays map data.
Bubble Chart. It displays data as a bubble chart.
Bubble Tree. It displays hierarchical data as a bubble tree.
Tree Map. It displays hierarchical data as a tree map.
Indicator. It displays data using a marked scale. This mode is available only in the web application.
All visualizers can be used in operations with objects given in the Basic Operations with Dashboard Objects and Setting Up Sketch Element Appearance sections.
Set up visualizer data source structure
Select data to build a visualizer
Set up block dimension synchronization
Show the data, based on which visualizer is built
See also:
 to move along the timeline.
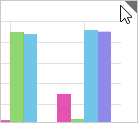

 button.