Tool interfaces in the web application and in the desktop application are identical, and differences in functionality are given in appropriate comments.
The Table visualizer is used to display data as a table.
To insert the visualizer, select:
The Table item in the drop-down list of the Visualizers button on the Home ribbon tab.
The Table button in the Visualizers group on the Insert ribbon tab.
The Table item in the drop-down menu of the New Block item of the dashboard's context menu.
Then set a table data source.
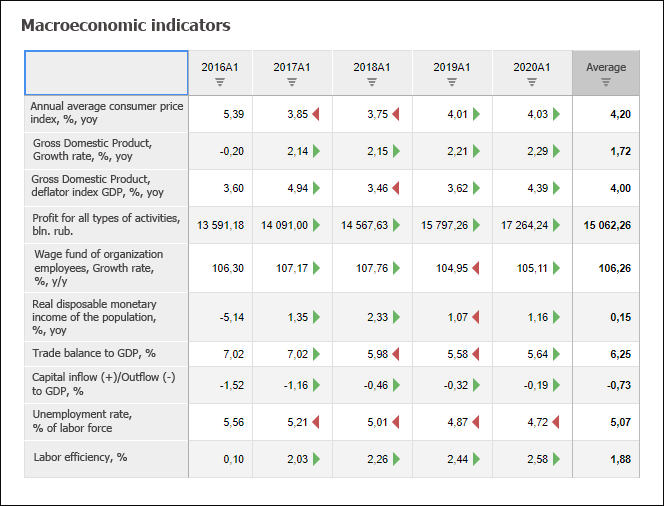
Example of the Table visualizer:
All operations with objects described in the Building Dashboard and Inserting and Setting Up Visualizers sections are available for the Table visualizer.
Select the Table > Settings item in the context menu to display side panel tabs that are used to set up a table.
See also:
Inserting and Setting Up Visualizers