 To display the tab
Tool interfaces in the web application and in the desktop application are identical, and differences in functionality are given in appropriate comments.
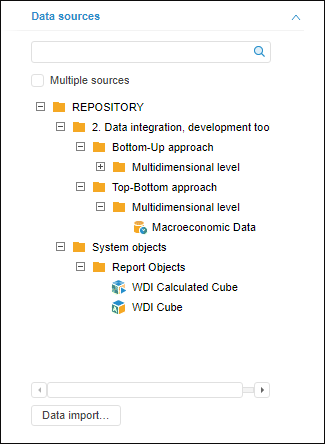
To select and set up a visualizer data source, there is the Data Sources tab on the side panel.
Cubes, child cubes of modeling container and time series database are available as a source. External data sources can be added by means of the data import wizard.
The tab displays all data sources in the repository available for the visualizer. For example:

Select the required data source in the object tree. The following is available for the selected data source:
Setting parameter values. Use the Data Source Parameters tab on the side panel.
Dimensions control. Use the Selection group of tabs on the side panel.
If the selected data source is already used by the other visualizer, visualizer dimensions can be synchronized. This will enable the user to manage selection in several visualizers at a time. Use the Dimension Synchronization tab to determine dimension synchronization parameters.
Additional operations:
 Select the type of loaded data
 Display data from several sources in the visualizer
For detailed description of working with data source dimensions see the Working with Dimensions section.
See also: