Tool interfaces in the web application and in the desktop application are identical, and differences in functionality are given in appropriate comments.
The Map visualizer is used to display map data. It is available to use maps of Foresight Analytics Platform, and the web application allows for using external map services, such as Google Maps, Bing, and so on.
IMPORTANT. Before getting started with the visualizer make sure that system requirements to client computer for the desktop application and to BI server for the web application. The web application supports work with visualizers if BI server is installed on Windows 10 or later. Visualizer appearance may differ depending on the graphic libraries in use (DirectX 11 or OpenGL 3.1).
To insert the visualizer, select:
The Map item in the drop-down menu of the Visualizers button on the Home ribbon tab.
The Map button in the Visualizers group on the Insert ribbon tab.
The Map item in the drop-down menu of the New Block item of the dashboard's context menu.
Then set a data source for a map. If a map is not set for the selected source, and the repository does not contain a map. used by default, the dialog box opens to select a topobase from repository. Select a topobase that will be used to build a map in the visualizer.
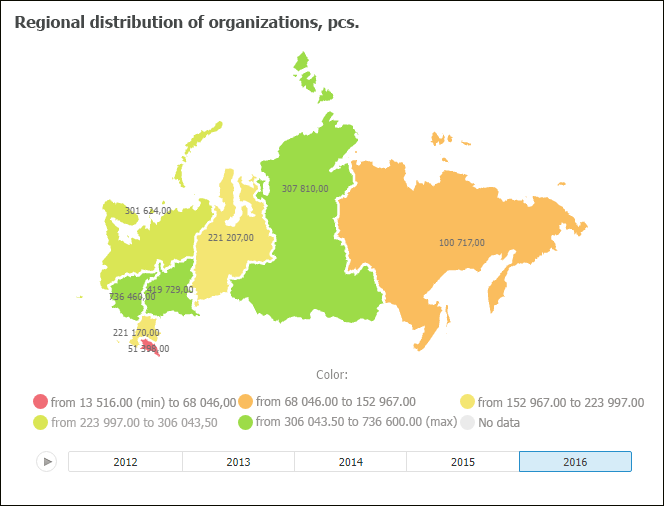
Example of the Map visualizer:
All operations with objects described in the Building Dashboard and Inserting and Setting Up Visualizers sections are available for the Map visualizer.
Basic features available for the visualizer:
Working in 3D mode.
Displaying timeline and playing animation on a map.
Connecting external map services.
Flexible setup of color legend, height legend and tooltips.
Territory fill on a map by various metrics, and other features.
A detailed description of features is given in the Setting Up Map section.
See also:
Inserting and Setting Up Visualizers