 Data drill down and drill up
Foresight Analytics Platform maps provide users with rich opportunities of visualizing various data by the following methods:
Data drill down is an operation, which enables the user to move through the data levels: from general to specific. Available drill down depth is determined by the hierarchy of the data source dimensions.
TIP. Make sure that map drill down is available. For details see the Requirements for Territory Drill Down section.
To drill down data:
Select the  Drill Down/Map >
  Drill Down item in the territory's context menu.
Double-click the territory.
Drill up is an operation, which enables the user to move from the specific data to general.
To drill up data:
Select the  Drill Up/Map >
  Drill Up item in the territory's context menu.
Hold down the SHIFT key and double-click the territory to be drilled up.
NOTE. Data drill down and drill up are not available in the Reports tool of the web application.
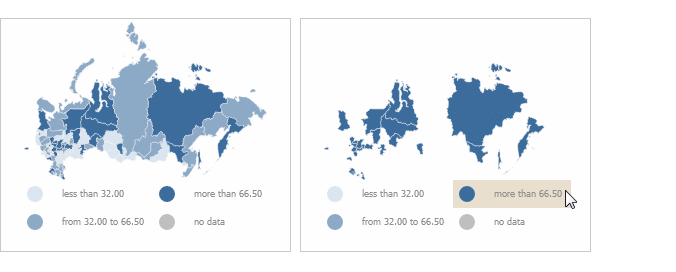
The example displays a map before drill down (left) and after drill down (right):

Use a legend to filter the displayed data. Hover the mouse cursor over the legend element. As a result, the map displays only the values corresponding to the selected element.
The example displays a map before filtering (left) and after filtering (right):

To extend map displaying capabilities, one can connect external map services: Yandex, Bing, ArcGis, OpenStreetMap, Google.
NOTE. The feature is available in the Dashboards, Analytical Queries (OLAP), Time Series Analysis tools only in the web application and in the designer of business applications.
To connect and use external map services, see the Connecting External Map Services to Map section.
NOTE. The feature is not available in the Time Series Analysis tool.
Territory outline enables the user to show borders of parent territory on the map when several child elements of the territory dimension are selected.
To show outlines, the system should meet all requirements given in the Requirements for Showing Territory Outlines section.
For details about territory outlines see the Showing Territory Outlines section.
NOTE. The feature is available in the Analytical Queries (OLAP) and Dashboards tools.
When working with a map, one can use operations of excluding particular areas by means of:
Changing selection in the observation objects dimension.
Executing map area context menu commands.
Consider operations of excluding areas from map executed by means of context menu commands. The context menu command can be executed for both one and several selected map areas.
TIP. To select several map areas, hold down the CTRL key during the selection.
To exclude:
Selected map area:
Select area to be excluded.
Select the Exclude/Map > Exclude item in the context menu of selected area.
The selected area will be excluded from the map.
All map areas except for the selected one:
Select the area to be kept on the map.
Select the Keep Only/Map > Keep Only item in the context menu of the selected area.
All areas will be excluded from the map, except for the selected one.
All map areas:
Open map's context menu.
Select the  Exclude All/Map >
  Exclude All item.
All areas will be excluded from the map.
To include:
Excluded map area:
Select the excluded map area to be included.
Select Include/Map > Include item in the context menu of the selected area.
The area will be included in the map.
All map areas:
Open map's context menu.
Select the  Include All/Map >
  Include All item.
All areas will be included in the map.
NOTE. The feature is not available in the Time Series Analysis tool.
Geolocation marker is a point linked to the territory. Markers enable the user to show locations necessary for the user, for example: shops or metro stations.
To show markers, the system should meet all requirements given in the Requirements for Showing Geolocation Markers section.
For details about markers and their settings see the Showing Geolocation Markers section.
A version map shows the frequency of territory divisions in time (division/association of territories).
For details about version maps see the Setting Up Version Map section.
NOTE. The feature is not available in the Time Series Analysis tool.
An arrow is a map object linked to two territories: the one where the arrow starts and the one where the arrow is directed. Arrows enable the user to visualize the direction of flows between territories, for example, export or import of goods.
To show arrows, the system should meet all requirements given in the Requirements for Showing Arrows section.
For details about arrows and their settings see the Showing Arrows section.
NOTE. The feature is not available in the Time Series Analysis tool.
Map charts enable the user to display additional information about territories.
To show charts, set up metrics dimension: specify metrics dimension elements, by values of which charts will be created.
For details about charts and their settings see the Showing Charts section.
See also:
Getting Started | Requirements for Working wit Map