In Foresight Analytics Platform, data analysis and building reports are executed by means of various tools and extensions. As a result of analysis the set of reports is generated including interactive ones, which are used to pass data to end users: managers, analysts, and so on.
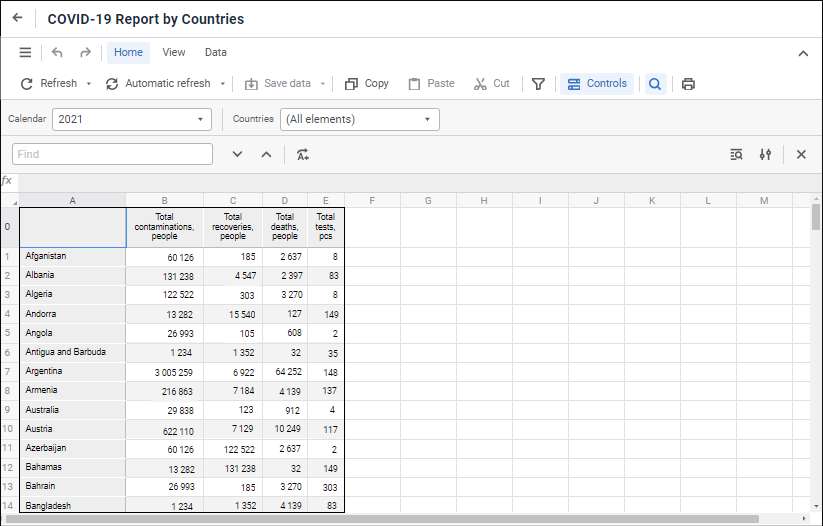
The Interactive Data Entry Forms extension is used to create forms for manual data input, to control input data and calculate indicators.
The Calculation Algorithms extension is used for automation of practices and algorithms.

The Reports tool is used to generate reports with the arbitrary structure of data presentation, which enables the user to combine table data, text, business graphics and various visualizers.
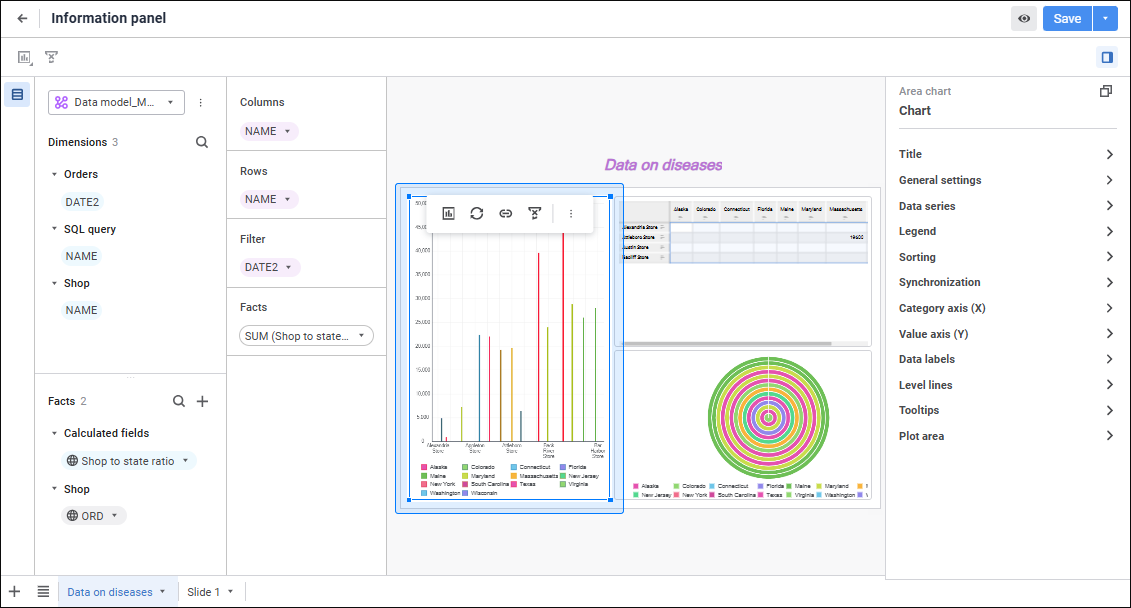
The Information Panel tool is used to solve data analysis, discovery and visualization tasks by means of interactive business graphics tools.
The Analytical Queries (OLAP) tool is used to form ad-hoc queries to data and execute analysis using business graphics tools and various analytical functions.

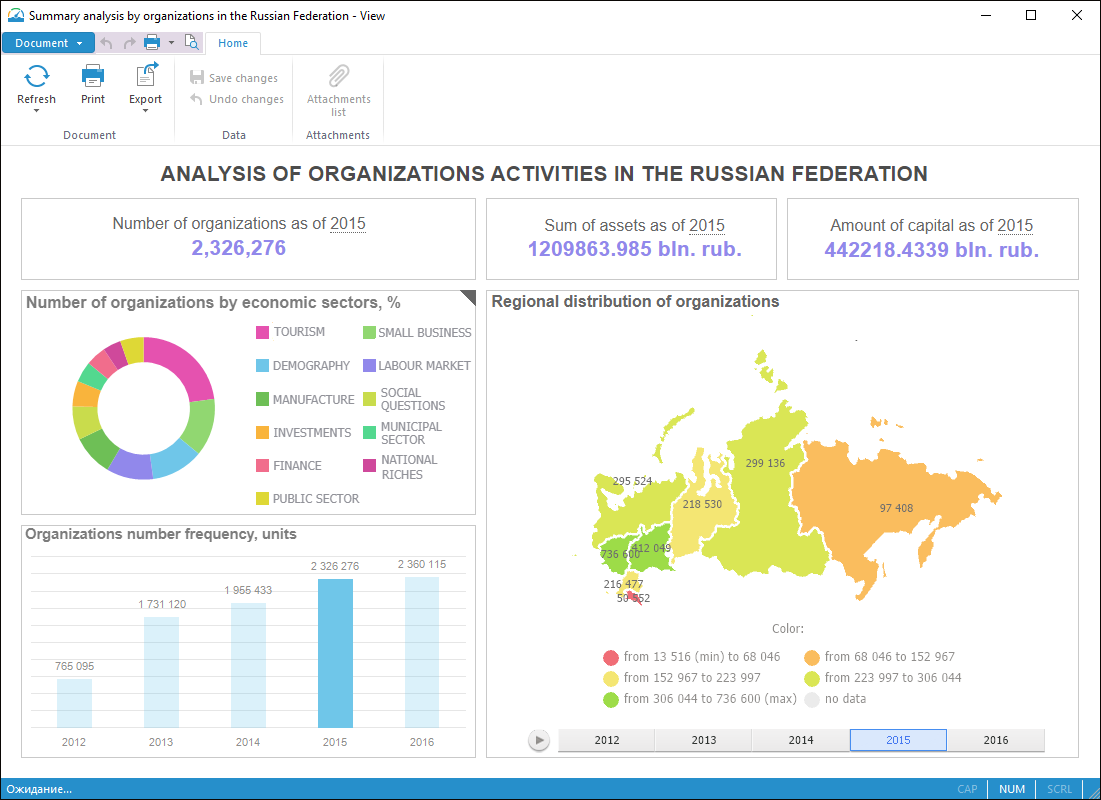
The Dashboards tool is used to present analytical documents based on information from various sources by means of a set of interrelated visualizers.
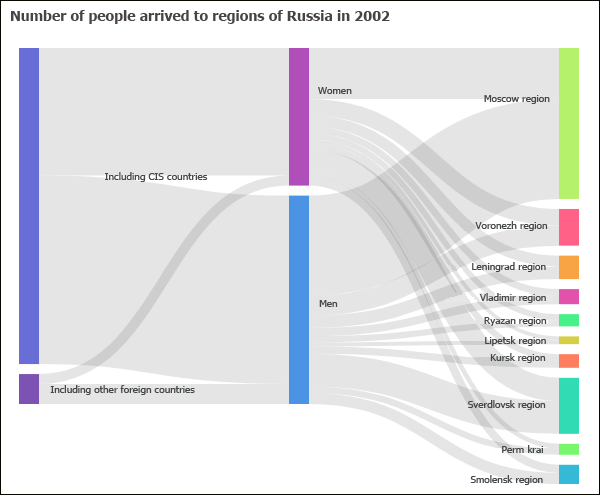
Foresight Analytics Platform tools enable the user to work with various visualizers that display data. If data is changed in the data source, data in all visualizers is automatically changed.
Foresight Analytics Platform tools allow for connecting plugins to enhance capabilities and to solve custom problems.