In this article:
Changing Default Repository Settings
Default repository settings can be used to set objects, object behavior, formatting of selected table elements in Foresight Analytics Platform tools with no need for their repeated selection or setup. For example, a default map will be used in all reports.
NOTE. One can set repository objects and set up report formatting in the web application default settings.
To determine default repository settings, use the Default Settings page/tab in the Parameters dialog box.

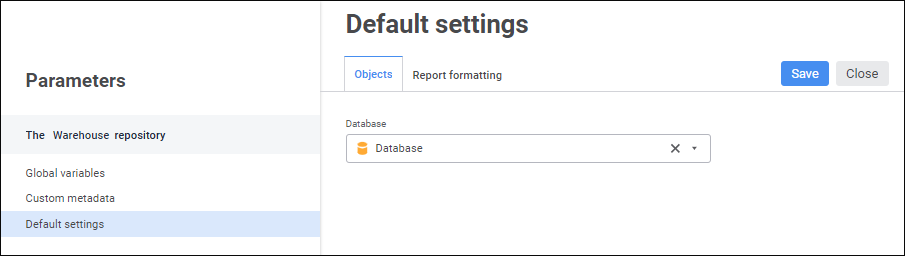
Objects
To set default repository objects, use the Objects tab.
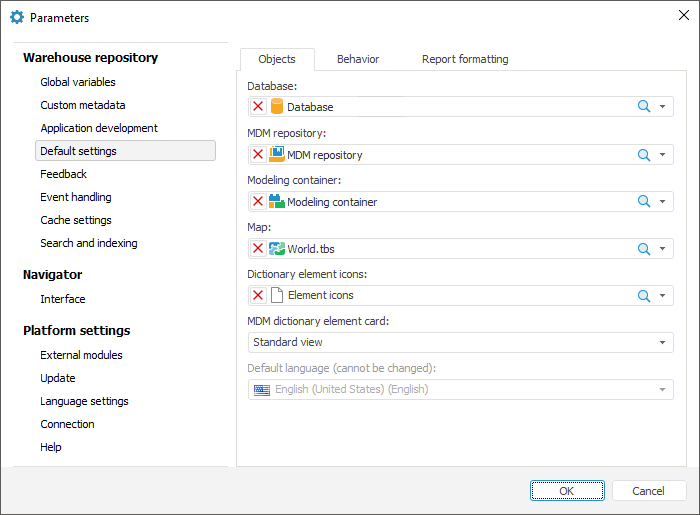
Set the parameters:
Database. Default database is required to provide correct work of the Foresight Analytics Platform tools. Database selected by default will be automatically selected to store data in table creation wizard and in MDM repository creation wizard, and it will also be used by data import wizard.
To quickly search for database in the repository, use the search string. In the web application, depending on object display settings, enter name, identifier, or key of the searched database into the search string. Search is executed automatically while the searched text is entered into the search string. The list will display only the databases, which names/identifiers/keys contain the entered text. To clear the search string, click the ![]() Clear button or press the BACKSPACE key.
Clear button or press the BACKSPACE key.
To set up displaying of repository objects on the side panel, click the  Display Object button and select display option in the drop-down menu:
Name. Objects are displayed with their names. Default option.
Identifier. Objects are displayed with their identifiers.
Key. Objects are displayed with their keys.
Several options can be selected. Identifier and key will be specified in brackets.
MDM Repository. Setting a default MDM repository is required for functioning of modeling container in the web application.
Modeling Container. A default modeling container will be used on creating a model in the web application.
Map. A repository map that will be automatically placed to all express reports, for which it is not selected explicitly. If a default map is not set, on the first map viewing the express report displays a dialog box to select corresponding repository object.
Dictionary Element Icons. A document containing picture, which will be split into icons and which will be displayed for dictionary elements. A picture is a series of horizontally placed icons of the 16*16 size in the BMP format.
MDM Dictionary Element Card. MDM dictionary element card that is set by default will be used on creating or editing dictionary element.
Default Language. Determine repository language that will be used by default in tools of Foresight Analytics Platform. A default language can be selected once, which means it cannot be modified in the future.
Default language selection is available if it was not set on creating a repository.
A default language affects translation into different languages of the following objects:
Custom class objects. The selected language will be used as a default language for resources. For details about resources see the Translating Resources section.
After executing the operations the selected default objects are used in tools of Foresight Analytics Platform.
NOTE. In the web application one can determine the Database parameter.
Behavior
To set up default behavior, use the Behavior tab:
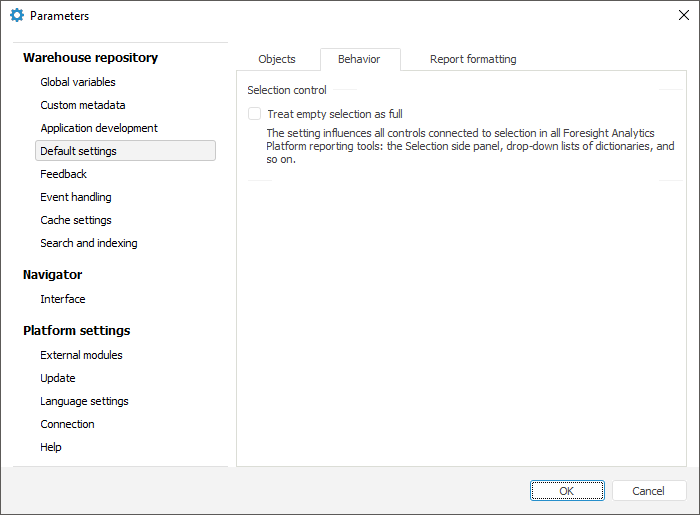
Set the parameters:
Treat Empty Selection as Full. The checkbox is deselected by default. Select the checkbox to view dimensions with deselected checkbox as dimensions with full selection. Therefore, visualizers will be built based on the full dimension selection regardless of the fact that dimension is fully deselected.
For details about working with dimension selection, see the Selecting Dimension Elements section.
NOTE. This behavior does not affect fixed metrics dimensions.
After executing the operations the specified default behavior is used in tools of Foresight Analytics Platform.
 Constraint to use parameter in data entry forms
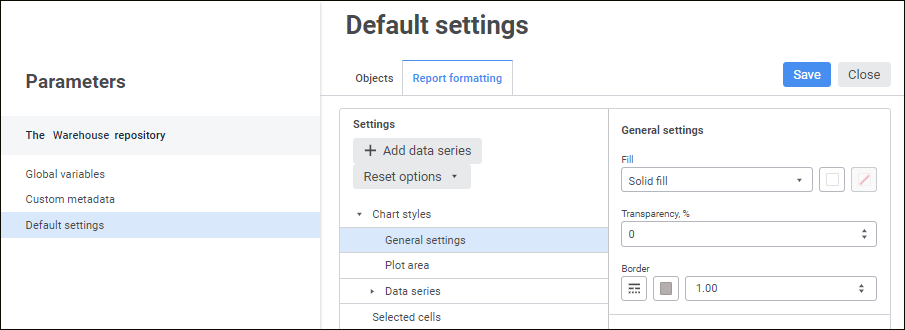
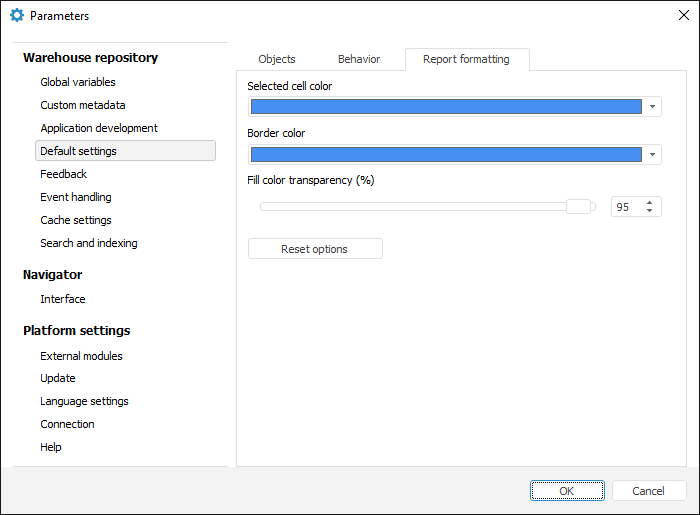
Report Formatting
To set up formatting of charts and tables in default reports, use the Report Formatting tab:
NOTE. Chart styles setup is available only in the web application.
Setting Up Chart Styles
To set up chart styles in reports, use the Chart Styles group of parameters Chart Styles in the Settings area and set the parameters:
To add a data series, click the  Add Data Series button. Ten data series are available by default.
To delete the selected data series, select the  Delete Data Series item in the drop-down menu of the
  Actions button.
To change data series order, use the Drag&Drop mechanism.
The configured chart styles are available on creating charts in reports.
Formatting of Selected Table Cells
In the web application use the Selected Cells group of parameters in the Settings area.
To format selected table cells in reports, set the parameters:
Selected Cell Fill Color/Selected Cell Fill. Select fill color for selected table cells in the drop-down color palette. One can also select a new color in the desktop application using the Other button. Blue fill color is used by default.
Border Color. Select border color for selected table cells in the drop-down color palette. One can also select a new color in the desktop application using the Other button. Blue border color is used by default.
Selected Cell Fill Transparency, %. Specify fill color transparency in percents for selected table cells: 100% - fill color is transparent, 1% - fill color is opaque. The 95% value is used by default as fill color transparency.
After executing the operations the configured formatting will be applied for selected table cells in all reports of the current repository.
Resetting Custom Settings
To reset custom settings and restore default formatting settings:
In the web application select the item in the drop-down menu of the Reset Settings button:
Reset chart settings.
Reset cell settings.
After executing one of the operations am information message is displayed to confirm the executed operation. Click the Continue button, after which custom formatting settings for charts or table cells will be reset.
In the desktop application click the Reset Settings button.