Tool interfaces in the web application and in the desktop application are identical, and differences in functionality are given in appropriate comments.
The Indicator visualizer is used to visually display data using a marked scale.
Several scales can be set up to provide a more visual data display. A rotating arrow is used to indicate the current value on a scale. Data of each scale can be divided into sectors (ranges), and the user can determine various colors for each sector to indicate sector position on the scale. For example, the green sector describes the available parameter values.
NOTE. The Indicator visualizer is available only in the web application. If a dashboard containing this visualizer is created in the web application, the block containing the indicator and its settings will be empty if the dashboard is opened in the desktop application.
To insert the visualizer, select:
The Indicator item in the drop-down menu of the Visualizers button on the Home ribbon tab.
The Indicator button in the Visualizers group on the Insert ribbon tab.
The Indicator item in the drop-down list of the New Block item of the dashboard's context menu.
Then set a data source for the indicator and set up dimensions.
NOTE. The Observation Objects dimensions are used as numeric values of indicator.
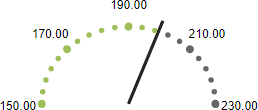
Example of the Indicator visualizer:
The indicator contains:
Timeline. It is used to show data changes in time. It can be disabled using the Speedometer side panel tab.
Indicator Area. It contains:
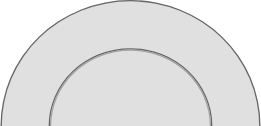
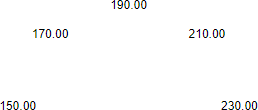
Scales. It is used show indicator values in graphic and numeric view. The indicator contains three scales:
Scale1. Color scale contains three sectors by default.
Scale2. Additional color scale. By default it is a background for scale-indicator and it contains four sectors.
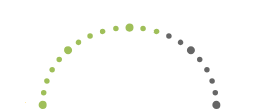
Scale3. Scale-indicator. Be default it includes the display of dimension values as marked range and numeric values and the specification of the dimension current value using the arrow.
Indicator Center. It is used to display rotation center and indicator of current value.
All operations with objects described in the Building Dashboard and Inserting and Setting Up Visualizers sections are available for the Indicator visualizer.
NOTE. Note that the Indicator visualizer cannot be exported.
The indicator is set up using the Format group of tabs on the side panel.
To do it follow the steps:
Set up basic parameters of indicator using the Speedometer side panel tab. To do it, set up timeline display, indicator paddings from internal visualizer borders, indicator background filling, indicator borders and transparency.
Set up scales one after another:
NOTE. The number of sectors inside the scales can be modified using the Sectors side panel tab.
Scale3:
Set scale parameters using the Scale side panel tab.
Set up dynamic highlight of indicators using the Dynamic Highlight side panel tab.
Determine indicator parameters using the Arrow side panel tab.
NOTE. It is not available to set up sectors for the Scale3 scale.
Determine settings of the rotation center and current value indicator using the Center side pnale tab.
See also:
Inserting and Setting Up Visualizers | How to Set Up the Indicator Visualizer?

 Sectors of the Scale1 scale