 To display the tab
Tool interfaces in the web application and in the desktop application are identical, and differences in functionality are given in appropriate comments.
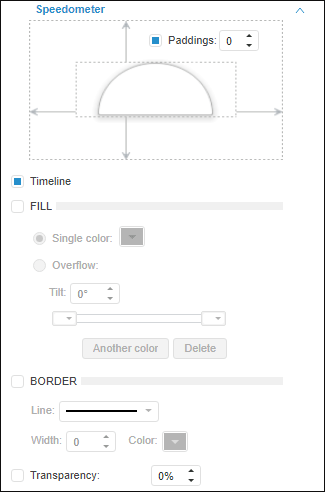
To set up basic parameters of indicator, use the Speedometer tab on the side panel.

Set the following parameters:
Paddings. Parameters of indicator paddings from internal visualizer borders. The checkbox is deselected by default, and paddings are not used. To set padding size, select this checkbox and specify required sizes.
Timeline. Timeline parameters. Timeline is available if in calendar dimension of visualizer several elements are selected.
The checkbox is selected by default, and a timeline is displayed. Deselect the checkbox to hide the timeline.
Fill. Parameters that determine indicator background fill. The checkbox is deselected by default, and the background fill is not used. To set up the fill, select the checkbox and select the radio button that corresponds to the required fill method:
Single Color. Background is filled with one color. Select background color in the corresponding color palette.
Overflow. Background is filled with gradient. Use the Tilt box to set angle of gradient tilt.
Floating color palettes are used to work with gradient colors. To change color share in the gradient, move the corresponding color palette.
Use the Another Color button to add a new color, and the Delete button to delete the current color.
Border. Parameters that determine indicator border. The checkbox is deselected by default, and no border is displayed. To display a border, select the checkbox and use appropriate boxes to set the following parameters: type, width and color of border line.
Transparency. Parameters that set indicator transparency. The checkbox is selected by default, and indicator transparency can be adjusted: 100% corresponds to transparency (the indicator becomes invisible), 0% corresponds to opacity.
See also: