In this article:
Comparing Metrics Dimension Element and Visualizer Characteristics
Setting Up Dimension Role
Setting up dimension role is available in regular reports in the desktop application, express reports, dashboards.
Dimension role can be used to set up visual displaying of several dimension elements for visualizers. For example, one can set color, font size, or cell fill in tables if a fixed dimension with the Metrics role is selected.
To set up dimension role, use drop-down menu of the  By Columns button, the
  By Rows button, or the
  Fixed button located to the left of the dimension name in the Selection group of tabs on the side panel:
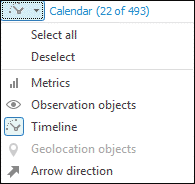
Dimension roles:
 Metrics. Dimension elements are used to display values as one or more metrics. Each visualizer has its own metrics set.
 Observation objects. Dimension elements are used as observation objects. By default, selection constraint of observation object dimension is 2000 elements and it can be set in one of the registry keys.
NOTE. The Observation Objects dimension is mandatory for plotting bubble charts, bubble trees and tree maps. The dimension for a map should additionally meet requirements for working with maps.
 Timeline (calendar dimension). Dimension elements are used to plot a timeline as calendar on creating calculated indicators.
 Geolocation objects. Dimension elements are displayed on a map as markers.
 Arrow direction. Territory dimension elements are used for arrow direction on a map. Selection in territory dimension with the Observation Objects role determines arrow start.
Dimensions without assigned role remain fixed.
NOTE. If several objects use one data slice in a regular report, slice dimensions will have identical roles.
Dimension role cannot be set up for the dimensions, which use the  Filter in Source position option.
Comparing Metrics Dimension Element and Visualizer Characteristics
Dimensions with the Metrics role can be used to control visualizer characteristics.
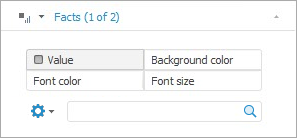
 Controlled characteristics of visualizers

Additional radio buttons are displayed on the dimension tab. The set of radio buttons depends on the visualizer type. The radio button name corresponds to the controlled characteristic:
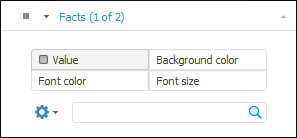
If the characteristic is set, it is selected.
To map dimension elements and visualizer characteristic:
Select the radio button that corresponds to the controlled visualizer characteristic.
Select the controlling dimension element.
After executing the operations the visualizer is rebuilt according to the specified metrics. For details about setting up table metrics see the Setting Up Table Metrics section.
Metrics Synchronization
To synchronize metrics between visualizers, select the Sync Metrics item in the drop-down menu of the  Settings button located below the dimension name in the Selection group of tabs on the side panel.
The following types of metrics can be synchronized:
The Value metric of a table with the Color metrics of a map, a bubble chart, a bubble tree and a tree map.
The Value metric of a chart with the Value metric of a table.
The Font Size metric of a table with the Size metrics of a bubble chart a bubble tree and a tree map with the Height metric of a map if the 3D mode is enabled.