Tool interfaces in the web application and in the desktop application are identical, and differences in functionality are given in appropriate comments.
By default the Indicator visualizer looks as follows:
To provide a required view to the Indicator visualizer, follow the steps:
Determine parameters of the Scale3 scale, arrow and dynamic highlight:
Determine parameters of indicators center:
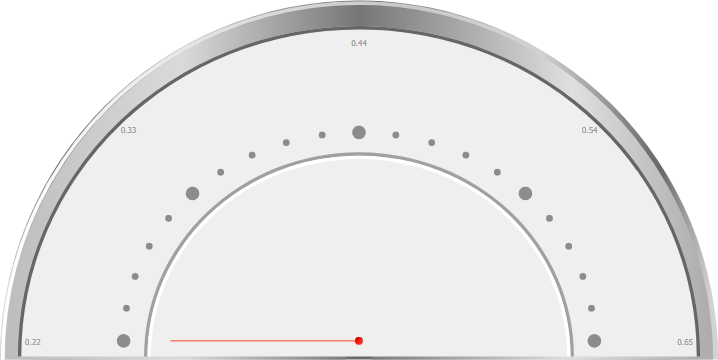
As a result the Indicator visualizer will be set up:
See also:
Questions and Answers | Setting Up the Indicator Visualizer