
 To display the Data tab on the side panel
Tool interfaces in the web application and in the desktop application are identical, and differences in functionality are given in appropriate comments.
To filter and transform data displayed by a visualizer, there are the Data tabs located on the side panel and the ribbon.
Filtering and transforming are applied to the table data, all other visualizers are based on the table.
To display the Data tab on the side panel
Operations executed on the Data ribbon tab:
Data transformation is used in fixed dimensions.
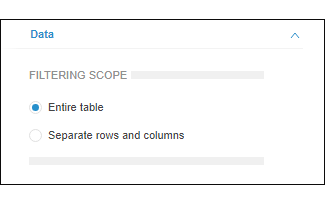
Using the Data tab on the side panel, determine the application area of the filtering: to the whole visualizer or separately to rows and columns.
NOTE. This setting affects filtering setup of all visualizers.
See also:
Selecting and Setting Up Visualizer Data Source