Tool interfaces in the web application and in the desktop application are identical, and differences in functionality are given in appropriate comments.
The Chart visualizer is used to visually display data.
To insert the visualizer, select:
The Chart item in the drop-down list of the Visualizers button on the Home ribbon tab.
The drop-down menu of the Chart button in the Visualizers group on the Insert ribbon tab.
Commands that correspond to chart types in the drop-down menu of the New Block item in the dashboard's context menu.
Then set the data source for the chart.
Available chart types: line, histogram, bar, area, pie, scatter, and other types.
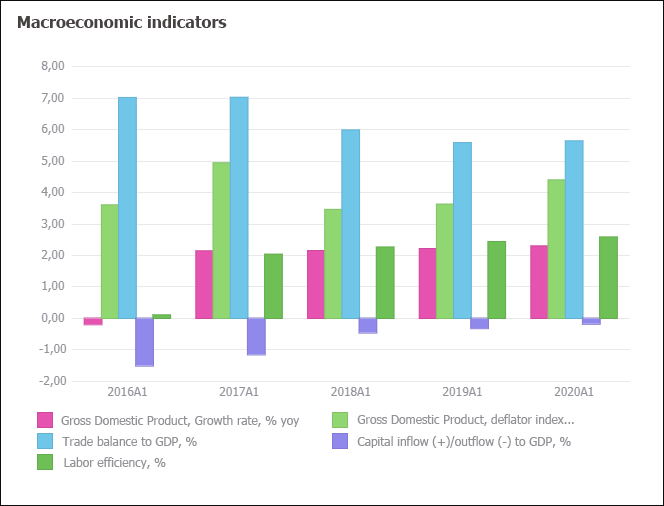
Example of the Chart visualizer:
All operations with objects described in the Building Dashboard and Inserting and Setting Up Visualizers sections are available for the Chart visualizer.
To set up chart format, open the visualizer's context menu and select the Chart item.
Below is a brief description of basic operations with chart. To get full description, see the Setting Up Chart Components and Working with Chart Data section.
 Set up general chart parameters
See also:
Inserting and Setting Up Visualizers

 Type button on the Chart ribbon tab. The menu contains icons that correspond to various
  Legend button on the Chart ribbon tab.