When working with a chart in the Reports, Analytical Queries (OLAP), Dashboard, and Time Series Analysis tools, there are several ways to exclude series from chart plot area: deselecting in the dimension and saving selection in the dimension.
In the Analytical Queries (OLAP) and Dashboards tools one can exclude series from the chart and deselect dimension elements.
The following can be excluded from the chart:
Selected series. Select the Exclude item in the series's context menu.
All series except the selected ones. Select the Leave Only item in the series's context menu.
NOTE. In the Dashboards tool, commands to exclude series are located in the Chart group in the data series's context menu.
Chart will be rebuilt. For the elements corresponding to excluded series, checkboxes will be deselected in the dimension.
To exclude series from the chart, click the series marker in the chart legend. The selected series will not be displayed in the chart plot area:
The series will be displayed in the legend as a marker with label.
For elements corresponding to the excluded series, checkboxes will be selected in the dimension.
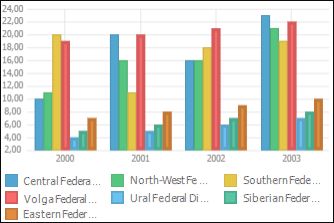
On charts from left to right:
All series are displayed.
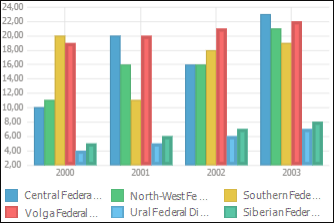
The Eastern Federal District series is excluded and dimension elements are deselected.
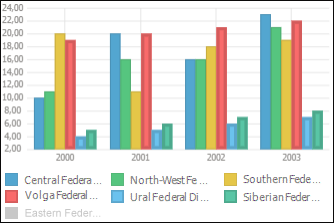
The Eastern Federal District series is excluded and dimension element selection is kept.
See also: