Axes are chart components that are used to organize data on a chart. Headers of table rows and columns form a coordinate grid that enables the user to determine each cell's address. The similar function is executed by the category axis (X) and the value axis (Y) on a chart. Axes are shown on all charts except for pie and doughnut charts, secondary histograms and secondary pie charts.
A secondary axis is an additional value axis that may contain:
Values of data series that strongly differ from other series' values.
Series values shown on the chart in different types of data (for example, price and volume).
One or several data series can be shown in the secondary axis.
A data series axis is a secondary category axis that is also named as chart height axis. The chart series axis is contained only in 3D histogram with groups.
The axis consists of several parts:
The following approaches can be used to set up chart axis parameters:
To set up chart axes parameters, use the Category Axis X, Value Axis Y and Value Axis (Secondary) tabs on the side panel.
NOTE. The Value Axis (Secondary) tab is shown if the Plot on Secondary Axis checkbox is selected on the Data Series tab for any of the chart series.
Tab appearance depends on the selected axis. For example, the Value Axis (Y) tab looks as follows:
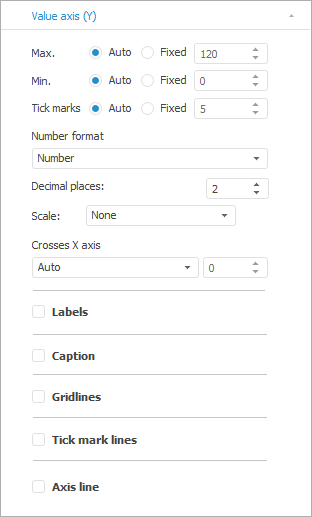
Define the following chart axis settings on the tab:
 Minimum and maximum axis values
See also:
Setting Up General Axis Parameters | Setting Up General Chart Parameters | Setting Up Chart Components


