In the table, set up totals calculation or distribution of data.
Select a chart plotted on table data and select the display version in the  Calculated Values button menu on the Chart ribbon tab.
A chart can display calculated data based on the source data. Calculated values are the following:
The Others item obtained after distribution.
To display calculated values:
In the table, set up totals calculation or distribution of data.
Select a chart plotted on table data and select the display version in the  Calculated Values button menu on the Chart ribbon tab.
To show source data, disable display version using the  Calculated Values button.
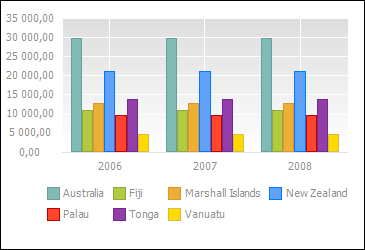
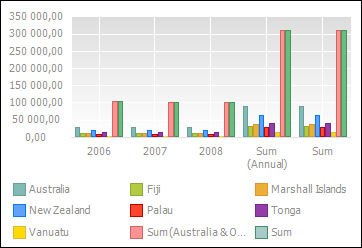
The chart appearance before (left) and after (right) the Sum calculated values display version are enabled by territory and calendar dimension levels:


In this case the following calculated values are enabled: the Sum by territory dimension levels and the Sum by calendar dimension levels.
See also: