Add a visualizer
Visualizers can be used to display a user-defined data slice of the built model in various formats. Various visualizer types can be used to create highly informative reports, execute detailed data analysis, and discover hidden patterns.
Available visualizers:
Summary table. It shows data as a table if a data model or a cube is selected as a data source.
Table. It shows data as a table if a table data set or a data model is selected as a data source.
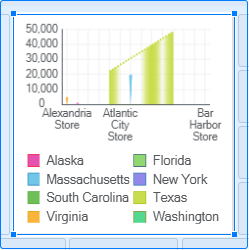
Chart. It displays data as graphs.
Text. It displays text information.
Image. It displays visual elements.
SVG Map. It displays map data with values changing in time.
Control. It controls data displayed by information panel objects.
Indicator. It displays data using a marked scale.
Map. It displays map data.
NOTE. If data is changed in data sources, data in all visualizers is automatically changed.
When working with information panels in the edit mode, the following operations are available depending on the visualizer type:
Select visualizer data element
The following operations are available for controls: adding, resizing, moving, and deleting.
For details about displaying visualizer data, see the Setting Up Data Visualization section.
See also:
Building Information Panel | Setting Up Data Visualization | Adding Slides and Working with Them | Synchronizing Visualizers on Slide
 Insert button on the toolbar and click the slide cell.

 Expand item in the drop-down menu of the
  Actions button on the popup settings panel.
 Collapse item in the drop-down menu of the

 Automatic Refresh button on the popup settings panel.
 Automatic Refresh button on the popup settings panel.
 Copy item in the drop-down menu of the
  Duplicate item in the drop-down menu of the
  Publish item in the drop-down menu of the
  Delete item in the drop-down menu of the
  SQL Filter item on the popup