Select the  Summary Table visualizer type:
The Summary Table visualizer is used to display data as a table if a data source is a data model or a cube.
To add the Summary Table visualizer to the working area:
Select the Summary Table visualizer type:
In the drop-down menu of the  Insert button on the toolbar. Then click the slide cell.
In the drop-down menu of the slide cell.
Add or select data source in the Sources drop-down list at the top of the control panel.
The operations given in the Adding Visualizers and Working with Them section are available for the Summary Table visualizer.
A pivot table consists of several main elements, each of them has its own settings:
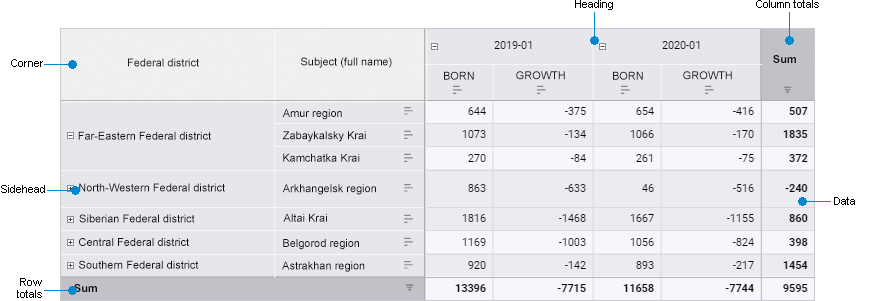
Pivot table structure includes the following elements:
Corner. The top left cell of the table that enables the user to show dimension names in rows and columns.
Sidehead. The table element that shows names of dimension elements located in rows.
Heading. The table element that shows names of dimension elements located in columns.
Data. The table element that consists of data cells.
Row/column totals. The table element that consists of row/column totals.
NOTE. The Row Totals and Column Totals menu items are displayed if displaying of row/column totals is enabled for table.
See also:
Adding Visualizers and Working with Them | Selecting and Setting Up Visualizer Data Source | Setting Up Data Visualization

 Create a table