Select the  Indicator visualizer in the drop-down menu of the
  Insert button on the toolbar and click the slide cell.
Click the slide cell and select the Indicator visualizer in the drop-down menu.
The Indicator visualizer consisting of indicator value and is used to track dynamic.
To add a visualizer to the working area:
Select the Indicator visualizer in the drop-down menu of the Insert button on the toolbar and click the slide cell.
Click the slide cell and select the Indicator visualizer in the drop-down menu.
Then add or select a data source in the Sources drop-down list in the upper part of the control panel.
NOTE. All operations given in the Adding Visualizers and Working with Them section are available for the Indicator visualizer.
The example of displaying indicator:

Available fields for plotting an indicator:
Trend line.
Filter.
Facts. The Facts box is displayed if information panel's data source is a data model.
To set up indicator, use the side panel.
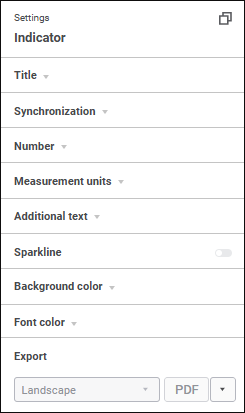
Available settings of indicator:
See also:
Adding Visualizers and Working with Them | Selecting and Setting Up Visualizer Data Source | Setting Up Data Visualization

 Open the side panel
 Settings button on the


