 Open the General Settings group of parameters
To set up chart view, stacking, background fill, and border, use the General Settings group of parameters on the side panel.
 Open the General Settings group of parameters
To open the General Settings group of parameters:
Select a chart.
Press the  Settings button on the toolbar. The side panel is hidden by default.
Select the required group of parameters.
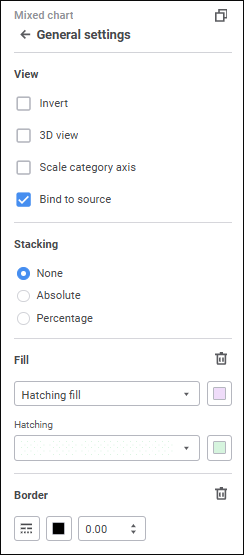
To set up visualizer view, set the parameters:
Scale orientation change setup is available for the following chart types: column charts, bar charts, line charts, mixed charts, pie charts, and are charts.
To change scale orientation, select the Invert checkbox. The X axis is oriented from bottom to top, and the Y axis is oriented from left to right. The order of series displaying in the legend will also be inverted. If the checkbox is deselected, scale orientation and series order are restored to the original view.
Setting up 3D chart view is available for the following charts: column charts, bar charts, line charts, mixed charts, pie charts, and area charts.
To display chart in 3D view, select the 3D View checkbox.
Scaling can be used to change the size of displayed chart area with saving proportions. Category axis scaling is used to manage displaying of chart area.
The setting is available for the following charts: column charts, bar charts, line charts, mixed charts, and area charts.
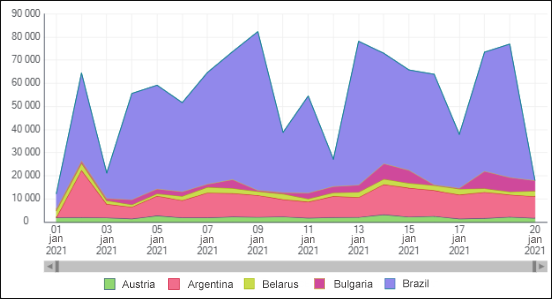
To change chart scale using the scroller, select the Scale Category Axis checkbox.
After the checkbox is selected, the scroller is displayed below the chart area:
To zoom, point the cursor to the scroller border. The pointer changes to the two-headed arrow:

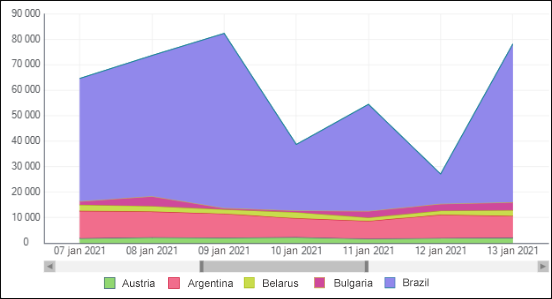
Click the scroller border and drag it. The chart is automatically rebuilt. The chart plot area will show the part corresponding to the scroller part:
To move the scroller, point the mouse pointer to it. The pointer changes to the four-headed arrow:

Click and hold down the mouse button to move the scroller part to the required position. The plot area will show the corresponding chart part.
To quick zoom, put the mouse pointer to the scroller or the chart area and scroll up the mouse wheel to zoom in and scroll down to zoom out.
To return the chart to original size:
Deselect the Scale Category Axis checkbox.
Move scroller borders to initial position.
Scroller view is disabled by default.
To save chart data series formatting, select the Bind to Source checkbox in the General Settings group of parameters on the side panel. After the checkbox is selected, data series formatting will not change in case of dimension selection changes.
NOTE. When working with mixed charts linear series will be brought to front relative to the other series types.
Stacking setup is available for the following charts: column charts, bar charts, line charts, mixed charts, and area charts.
To plot a stacked chart, select stacking option in the General Settings group on the side panel:
None. A chart shows absolute values of a series.
Absolute. A chart shows values with stacking allowing to assess part of each value in the total sum.
Percent. A chart shows values as percentage allowing to assess part of each value in the total sum.
Stacking settings are hidden by default.
Background fill settings are available for various visualizers in groups of parameters:
Fill. The setting is available for all chart types, except Sankey charts and scatter charts. To set up visualizer fill, select fill type:
No Fill. Visualizer background is not filled.
Solid Fill. Specify fill color in the drop-down palette. If required, specify opacity percent in the Opacity box.
Two-Color Fill. Specify start and end colors of the gradient in the drop-down palettes. If required, specify tilt angle and gradient opacity percent in the Rotate Tilt Angle and Opacity boxes.
Hatching Fill. Specify fill color in the drop-down palette, select hatching color in the drop-down list, and set hatching color. If required, specify fill opacity percent in the Opacity box.
NOTE. When setting opacity for solid, gradient, or hatching fill, take into account that 0% corresponds with full transparency (visualizer background is invisible), 100% corresponds with full opacity.
To reset the settings and restore the default style, click the  Delete button.
Background. The setting is available for slides and the following visualizers: Sankey Chart, Scatter Chart, Indicator, Text, and Image. To set up background fill, select the required colors in the drop-down color palette.
To reset the determined settings and restore the default style, click the Reset button.
To set up chart border, set:
Line Type. Select line type in the drop-down list.
Line Color. Select line color in the drop-down palette.
Line width. Set the required line width using the keyboard or the value editor.
To reset the settings and restore the default style, click the Delete button.
See also: