
 Open the Legend group of parameters
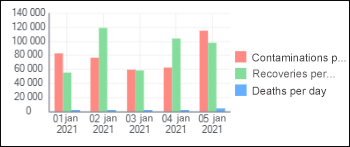
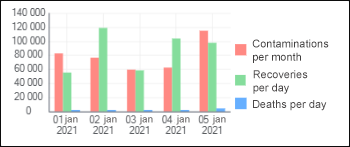
A legend contains names and markers of data series in the chart. The order of displaying data series in the legend corresponds with their order on a chart.
NOTE. A legend displays only the data series, for which the Show in Legend checkbox is selected.
After conditional formatting rules are added, the legend will display the series fill colors that were specified before applying conditional formatting rules.
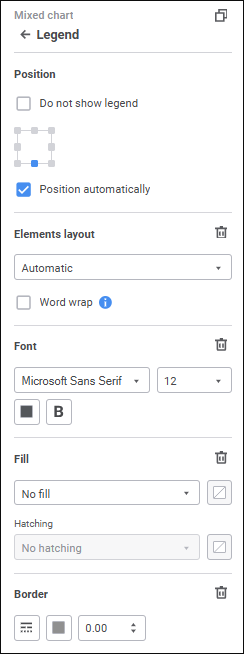
To set up chart legend, use the Legend group of parameters on the side panel.
Open the Legend group of parameters
Legend setup is available for all visualizer types, except the Table and Sankey Chart.
To set up chart legend, set the parameters:
See also:
 Settings button on the
 Delete button.