Select the  Map visualizer in the drop-down menu of the
  Insert button on the toolbar and click the slide cell.
Click the slide cell and select the Map visualizer in the drop-down menu.
The Map visualizer is used to solve geodata analysis tasks and display data based on their geographic position. The tool uses the OpenStreetMap open-source map service to display maps.
To add a visualizer to the working area:
Select the Map visualizer in the drop-down menu of the Insert button on the toolbar and click the slide cell.
Click the slide cell and select the Map visualizer in the drop-down menu.
Then add or select a data source in the Sources drop-down list in the upper part of the control panel.
NOTE. All operations given in the Adding Visualizers and Working with Them article are available for the Map visualizer.
The example of displaying a map:

Available fields for displaying a map:
Facts. The Fields box is displayed if information panel's data source is a data model.
Size.
To set up a map, use the side panel.
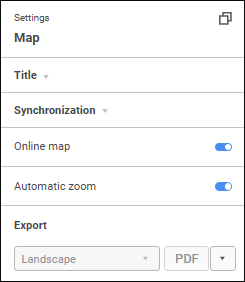
Available map settings:
 Set up displaying of online map
View information about map points
See also:
Adding Visualizers and Working with Them | Selecting and Setting Up Visualizer Data Source | Setting Up Data Visualization

 Settings button on the