Make sure that the requirements for working with maps are met.
Select the  SVG Map visualizer:
The SVG Map visualizer is used to solve indicator analysis tasks based on their geographic position.
To add a visualizer to the working area:
Make sure that the requirements for working with maps are met.
Select the SVG Map visualizer:
In the drop-down menu of the  Insert button on the toolbar and click the slide cell.
In the drop-down menu of the slide cell.
If the default map is not set in repository settings , the Select Topobase dialog box opens for selecting the required repository object.
Add or select data source in the Sources drop-down list in the upper part of the control panel.
NOTE. A standard cube should be selected as a data source for an SVG map.
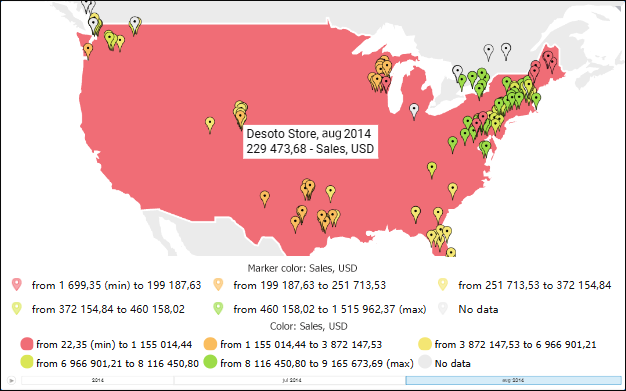
All operations given in the Adding Visualizers and Working with Them section are available for the SVG Map visualizer.
To create an SVG map, use the fields:
Marker is a point bound to territory. Markers can be used to display geolocation objects on a map. When hovering the mouse over the marker the user can set up showing of the tooltip containing various information about the point, to which it is linked (for example, the company name).
One can add only one dimension in the Marker box.
Markers are displayed when the following conditions are satisfied:
Map data source contains a dimension of geolocation objects. This dimension should be based on an MDM dictionary containing the LATITUDE and LONGITUDE real attributes. Attributes should contain latitude and longitude values for geolocation markers.
The Markers and Observation Objects boxes should be filled in.
To fill geolocation markers with color, fill in the Marker Color box and select the element, which values will be used to fill markers.
A Foresight Analytics Platform map is used that contains the <fs:Geo> attribute or the map of the following external map services: Google or Yandex.
One can add only one territory dimension.
The territory dictionary should contain the TERRID real attribute with values corresponding to the ID attribute values for the map. Map regions will be filled with color according to the selected metrics element only if values of the TERRID attribute in the territory dictionary correspond to values of the attribute in the topobase.
One can add only one dimension in the Timeline box. The dimension can have any type, including calendar one.
Timeline shows frequency of observation objects by specified metrics in the certain time period and is available if several elements are selected in the dimension.
Timeline tick marks are displayed as names of selected dimension elements.
Filter can be set based on all dimensions. One can add several dimensions.
Standard cube dimensions with enabled aggregation method, if placed in the Filter box, are excluded from creating a data view.
When the dimension is placed in the Filter box, all its elements are selected.
The box is used to set a dictionary element to get an object color value. Object fill is calculated by the color scale. The scale specifies the set of number intervals and the fill method for each interval.
One can add only one dimension in the Object Color box.
The box is used to select a dictionary element to get marker value and is used in the legend and marker fill.
One can add only one dimension in the Marker Color box.
To set up a map, use the side panel.
To open the side panel:
Select the required visualizer on the slide.
Press the  Settings button on the toolbar. The side panel is hidden by default.
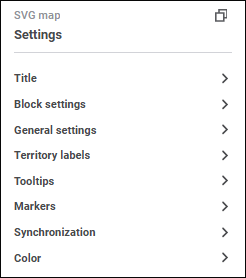
Available map settings:
For details see the Setting Up Title section.
Select the required map in the drop-down list.
To extend map displaying capabilities, select external map services in the drop-down list: Yandex, Bing, ArcGis, OpenStreetMap, Google. To connect and use external map services, see the Connecting External Map Services to Map section.
To use a map that is set as default in the repository, click the Default button.
To show territory labels, toggle the Territory Labels switch to active state. Territory labels are not shown by default.
Determine territory label text settings. A custom text, template can be set for the label, or combination of both. To enter text and templates, use the Text box.
To add a template to label text, select one of the available text templates in drop-down menu of the Add Template button:
Observation object name.
Color (indicator).
Color (value).
The selected template will be added to label text after cursor position.
If required, enter the text to the edit box that will be displayed if the territory has no data.
Determine territory label text font options:
Font. Select one of the available fonts in the drop-down list. If required, one can load custom fonts.
Font Size. Select the required font size. Size is set in points, it can be selected in the drop-down list or entered using the keyboard. The range of available values: [6; 36].
Color. Select font color in the drop-down palette.
One can select standard and custom colors. The palette contains only standard colors by default.
To create a custom color:
Click the Add Color button. The advanced color palette opens.
Select a color in the advanced color palette, use color picker to select color on a browser page, or set color code in the RGB or HEX format.
After executing the operations the custom color is created and added to the palette.
NOTE. The maximum possible number of custom colors in the palette is 23.
To delete the custom color from the palette, select the Delete item in the selected color's context menu.
Font Style. Select font style:
B. Bold.
I. Italic.
U. Underline.
When the button is pressed, the corresponding font style is used. Several styles can be used simultaneously, for example, pressed B and I buttons result in bold italic font style.
Specify territory label fill color in the drop-down palette. If required, specify fill opacity percent in the Opacity box. Setting a custom fill color for territory label is identical to setting a custom color of label font.
To set up territory label border, set:
Line Type. Select line type in the drop-down list.
Line Color. Select line color in the drop-down palette.
Line Width. Set the required line width using the keyboard or the value editor.
Indicator Color. When the checkbox is selected, label border color matches the color of the territory, for which the label is displayed. The checkbox is deselected by default.
To reset the settings and restore the default style, click the  Delete button.
Tooltip settings are identical to territory label settings.
Marker setup is available if a dimension is set in the Markers box.
Determine marker settings:
Marker Color. Select marker color option:
Uniform Marker Color. Specify marker fill color in the drop-down palette. Setting a custom fill color for markers is identical to setting a custom color of label font.
Indicator Color. Marker color depends on values of the indicator selected in the Marker Color box. Marker colors can be predefined in the automatic palette or determined by the user.
Automatic Scale. Toggle the switch to active state if it is required to calculate scale intervals automatically. Set calculation parameters:
Intervals. Set the number of intervals using the value editor or the keyboard: from 2 to 10.
Quantiles. Select the checkbox if it is required to use scale quantiles. When the checkbox is selected, the range is split into intervals depending on the elements selected in the dimensions. Intervals may be of different length. When the checkbox is deselected, intervals will be equal in length and will not depend on the elements selected in the dimension.
Exact Colors. Specify interval fill color in the drop-down palette. Setting a custom fill color for markers is identical to setting a custom color of label font. The number of palettes matches the number of intervals.
If the Automatic Scale switch is inactive, exact scale intervals specified by the user will be used:
Add Interval. To add an interval, set the bottom border of the interval using the value editor or the keyboard, then click the Add button. The top border of the interval is determined automatically based on the orders of the next interval.
Set up Interval Color. Specify the color of each interval in the drop-down palette.
Delete Interval. To delete the selected interval, click the Delete button. The interval will be deleted, the bottom border of the next interval will be recalculated.
In the No Data drop-down palette specify fill color for the object markers, which have no data.
To show the marker legend, toggle the Marker Legend switch to active state. Select the legend layout option relative to the map area: top left corner, top border center, top right corner, right border center, bottom right corner, block bottom border center , bottom left corner, left border center. Legend's default position is set to bottom border center:

Legend font, fill, and border settings are identical to territory label settings.
To hide the marker legend, toggle the Marker Legend switch to inactive state.
To show marker tooltips, toggle the Marker Tooltips switch to active state. Marker tooltip font, fill, and border settings are identical to territory label settings. To hide marker tooltips, toggle the Marker Tooltips switch to inactive state.
Object legend and color settings are identical to automatic scale and legend settings of markers.
For details about the setting see the Synchronizing Visualizers on Slide section.
To select a map area, click the required element. To select multiple map areas, click on the required elements while holding down the CTRL key.
As a result, the visualizer and its data element are selected:
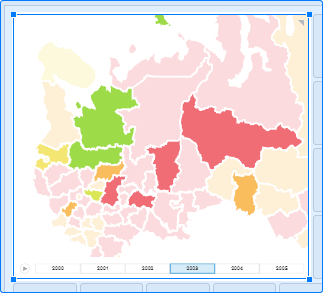
To change map zoom, focus the map and scroll the mouse wheel while holding down the ALT key. Scroll up the mouse wheel to zoom in and scroll down to zoom out.
Map zoom is bound to the area under the cursor.
To move in a map, hold down the CTRL key and the mouse button and move the cursor in the required direction. The visible map area moves after the cursor.

 View information about map points
To view information about a map point, hover the cursor on it. A tooltip with point data is displayed:
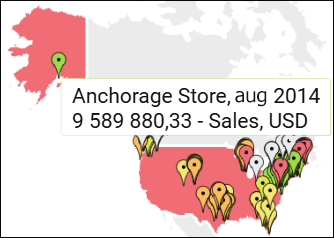
The function is available if a dimension is set in the Markers box.
Data drilldown is the operation, which enables the user to move through data levels: from totals to detailed ones. Available drilldown depth is determined by the hierarchy of data source dimensions.
TIP. Make sure that map drilldown is available. For details see the Requirements for Territory Drilldown section.
To drill down data, select the Drill Down item in the territory's context menu.
Drillup is the opposite operation to drilldown allowing to move from specific to general data.
To drill up data, select the Drill Up item in the territory's context menu.
To go back to the previous map state during drilldown and drillup, select the Back item in the territory's context menu.
To undo all changes during drilldown and drillup, select the To Original State item in the territory's context menu.
For details see the Setting Up SQL Filter section.
See also:
Adding Visualizers and Working with Them | Selecting and Setting Up Visualizer Data Source | Setting Up Data Visualization