A data table is a spreadsheet built on data source dimension selection.
To work with a table:
In the Analytical Queries (OLAP) tool tap the Table button at the center of the page top panel.
In the Dashboards tool:
Tap the table title.
Go to the full-screen mode of blocks and select a block with the table.
NOTE. If data selection synchronization, is set up in the loaded dashboard, its work will be restricted: data will be transferred only from the table to other visualizers. Selection in other visualizers will not be transferred to the table.

To work with dimensions, use the Layout panel at the left page edge.
To set up table parameters:
Tap the  button at the top right corner of the express report or dashboard page.
Tap the table corner.
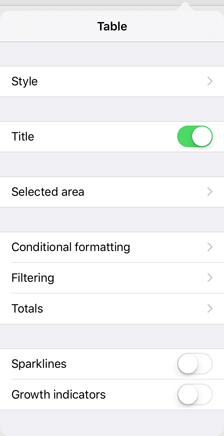
Executing one of these operations opens the Table dialog box:

It is also available to set up parameters of a single column or row, table rotation and zoom.
NOTE. Column and row setup, table rotation are available only in the Analytical Queries (OLAP) tool.
See also: