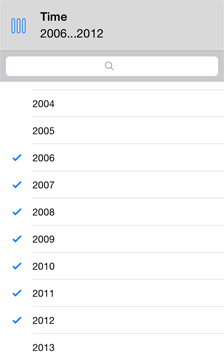
To select data to be displayed by means of visualizers, use the element selection function:
Multiple selection is available in the Table and Chart visualizers:
For dimensions in rows or columns.
For fixed dimensions if aggregation method was created in the desktop application report.
Elements for that no data is available are displayed in grey color.
The dimension role is set in the Map, Bubble Chart, Tree Map and Bubble Tree views instead of dimension layout.
To change selection in the Table and Chart visualizers, open the required dimension on the side tab and execute one of the operations:
To select or deselect an element, tap it in the list:

Tap the button to the left of the dimension name to access the extended selection options:
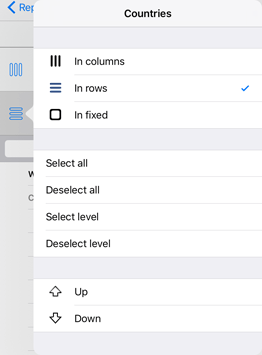
Select All. All dimension elements are selected.
Deselect. Deselects all dimension elements.
Select Level. All elements of the current hierarchical level are selected.
Deselect Level. All elements of the current hierarchical level are deselected.
NOTE. Selection options are available via dimension menu only for dimensions with multiple selection.
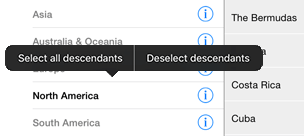
Press and hold the parent when working with hierarchical dimension. The popup menu appears to select all or deselect all descendants:
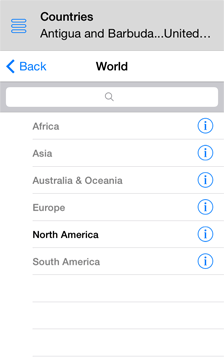
To go to the list of children one level down, use the  button next to the elements in the list of dimensions.
To return to the upper level, use the Back button in the dimension panel header:
To search for dimension elements:
Select the dimension on the Layout panel.
Enter the word or its part into the search field. The dimension elements, which names contain a matching character sequence, are shown in the list:
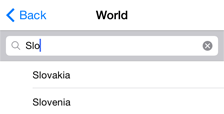
To return to the full list of elements, tap the  button at the end of the search field.
See also: