To change data displayed in the visualizer, set up dimensions layout and role.
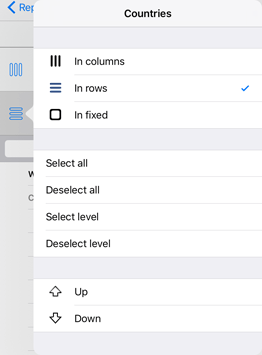
Specify the dimensions for table and chart that should be displayed in table rows or columns, and the dimensions that should be excluded from rows and columns, that is, fixed ones. By changing the position of dimensions, find the best match view of the data to be analyzed.
A dimension role is specified for bubble charts, maps, bubble trees and tree maps instead of dimension layout. Tables and charts use only the Value metric. The metric is set by default after the Metrics role is set for the dimension.
To set up dimension layout and role, tap the dimension button to the left of the dimension name:

Dimension layout and role are identified by the dimension button icon.
The Table and Chart visualizers have the following dimensions layout options:
![]() In Columns. Dimension elements are located in columns.
In Columns. Dimension elements are located in columns.
![]() In Rows. Dimension elements are located in rows.
In Rows. Dimension elements are located in rows.
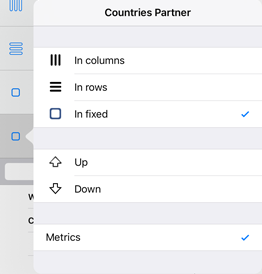
![]() In Fixed. Dimension elements are used as values. Multiple selection is available for elements in the fixed dimension if aggregation method is set in the desktop application express report. Otherwise, only one element can be selected.
In Fixed. Dimension elements are used as values. Multiple selection is available for elements in the fixed dimension if aggregation method is set in the desktop application express report. Otherwise, only one element can be selected.
A fixed dimension can also be used as a metric. To do this, select the Metrics checkbox in the dimension menu:

The selected element in the metrics dimension is used to display values.
Use the Up and Down commands to change tab position. Tab position can be changed only between equally positioned dimensions.
NOTE. The Up menu item is not available for the top tab, the Down menu item is not available for the bottom tab.
The dimension role is set in the Map, Bubble Chart, Tree Map and Bubble Tree visualizers instead of dimension layout:
![]() Timeline. Dimension elements are used to build a timeline.
Timeline. Dimension elements are used to build a timeline.
![]() Observation Objects. Dimension elements are used as observation objects.
Observation Objects. Dimension elements are used as observation objects.
![]() Metrics. Dimension elements are used to display values as one or several metrics.
Metrics. Dimension elements are used to display values as one or several metrics.
![]() Without a Role. Dimension elements are used as values. Multiple selection is available for elements if aggregation method was set in the desktop application express report. Otherwise only one element can be selected.
Without a Role. Dimension elements are used as values. Multiple selection is available for elements if aggregation method was set in the desktop application express report. Otherwise only one element can be selected.
If the Metrics role is set for the dimension, to select the element, select the visualizer parameter, which should be controlled by the element:

Available parameters depend on the visualizer type.
To map dimension element and visualizer parameter:
Tap the dimension element that will control the visualizer parameter.
Select the checkbox next to the visualizer parameter for the element in the popup menu.
A dimension element can control several visualizer characteristics that are set for one dimension element.
NOTE. Several dimension elements can be set for microchart characteristics.
Metrics dimension elements enable the user to control the following parameters:
 For a bubble tree and a tree map
See also: