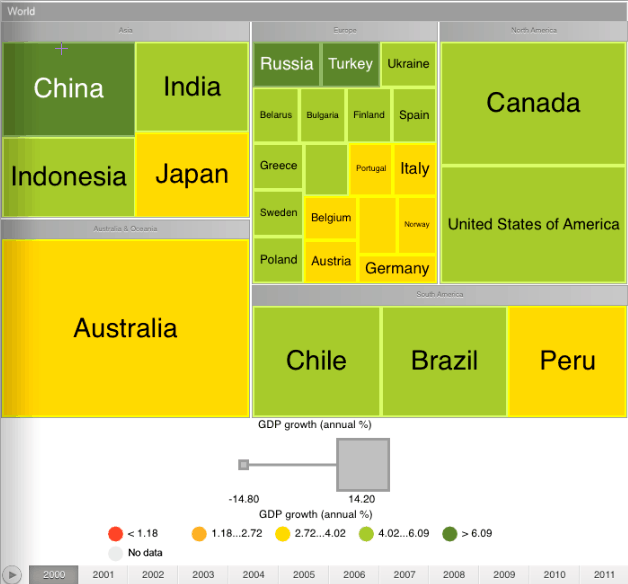
A tree map allows hierarchical data to be displayed as a set of nested rectangles. Each hierarchical branch is represented with a rectangle that consists of smaller rectangles that are subbranches. Each rectangle's area is proportional to the value of the corresponding hierarchical element. Rectangle color is also determined by hierarchy element value.
To work with a tree map:
In the Analytical Queries (OLAP) tool tap the Tree Map button in the center of the page top panel.
In the Dashboards tool:
Tap the tree map title.
Go to the full-screen mode of blocks and select the block with a tree map.

To work with dimensions, use the Layout panel at the left page edge.
A tree map enables the user to display two value sets for hierarchical data:
The first value determines rectangle color.
The second value determines rectangle area.
Tree map advantages:
It enables the user to find interrelation between two factors in a hierarchical data structure.
It enables the user to use space efficiently.
It allows a large number of elements to be displayed at the same time.
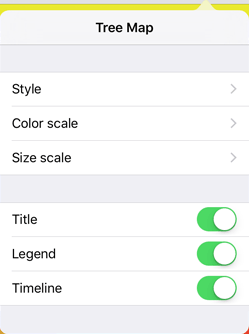
To set up tree map parameters, tap the  button at the top right corner of express report or dashboard page.
After this the Tree Map dialog box opens:

See also: