Tap the  button at the top right corner. The visualizer settings dialog box opens.
Select the Size Scale item. The Size dialog box opens.
Size setup is changing of parameters that are used to set up the size of elements of bubble chart, bubble tree and tree map.
To set up size:
Tap the  button at the top right corner. The visualizer settings dialog box opens.
Select the Size Scale item. The Size dialog box opens.
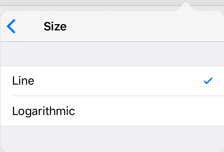
The Size dialog box for bubble tree and tree map:

Select line or logarithmic scale type to calculate bubble or rectangle size.
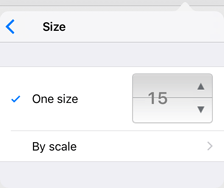
The Size dialog box for a bubble chart:

The following settings are available:
One Size. Select the checkbox and set size in pixels to be used for all bubble chart bubbles.
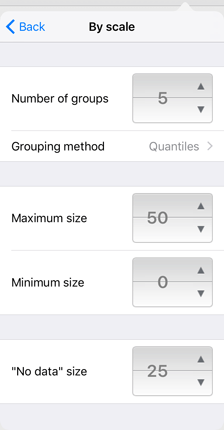
By Scale. Select the checkbox to make the bubble color dependent on values of the selected metric. The By Scale dialog box opens:

The following settings are available for the size by scale:
Number of Groups. Determine the number of groups to divide the values of the selected metric. A specific bubble size is selected for each group.
Grouping Method. Determine how the values are divided into groups:
Quantiles. The entire data range is divided into the specified number of groups, containing the equal number of units of different length.
Equal. The entire data range is divided into the specified number of groups of the same length.
Maximum Size. Use the number editor to determine the maximum bubble size in pixels.
Minimum Size. Use the value editor to determine the minimum bubble size in pixels.
"No Data" Size. Use the value editor to determine bubble diameter to be used for empty values.
See also:
Setting Up Visualizers | Bubble Chart | Bubble Tree | Tree Map