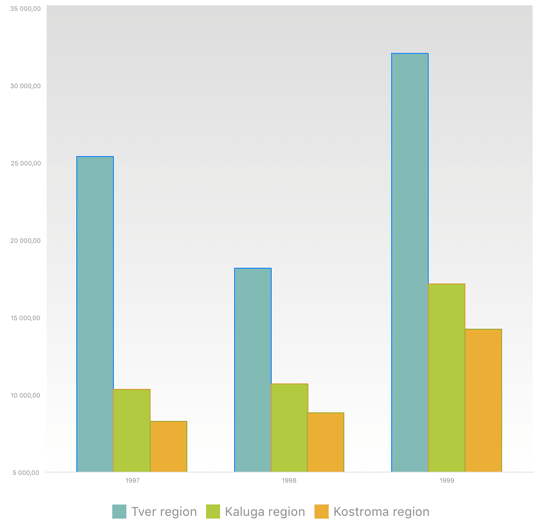
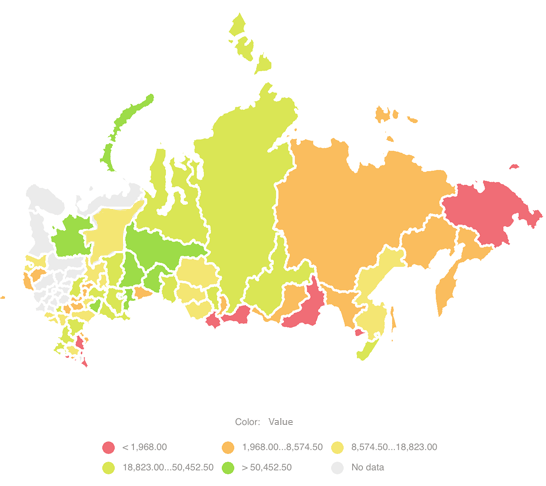
A legend is used to explain the data displayed in the view.
A legend is displayed in charts, maps, bubble charts, tree maps and bubble trees. Depending on the visualizer type and selected metrics, the visualizer may have different legends: color legend, height or size legend, pie chart legend, column chart legend, arrow legend. Several legends can be displayed for one visualizer if several metrics are selected.
A legend is displayed by default.
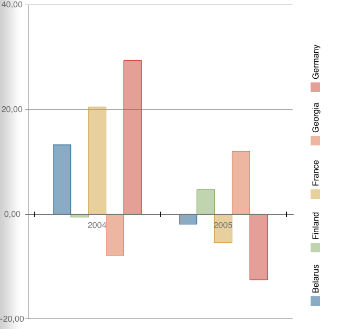
Examples of chart and map legends:


To display the legend:
Tap the  button at the top right corner. The visualizer settings dialog box opens.
Enable the Legend switch button in the dialog box that opens.
To hide the legend, return the switch button to its initial state.
To change chart legend position:
Tap the  button at the top right corner.
Select the Legend item in the dialog box.
Select the legend position option relative to the plot area in the list:
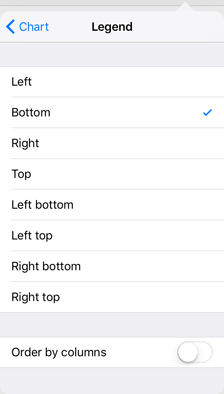
If the Order by Column switch button is enabled, set the number of columns that will contain legend data. Legend data is located in rows by default.
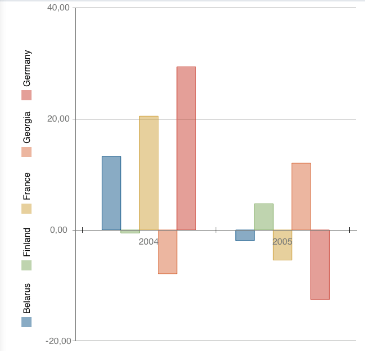
Examples of legend position to the left and to the right:
See also:
Setting Up Visualizers | Chart | Map | Bubble Chart | Bubble Tree | Tree Map