A map is used to display map data.
To work with a map:
In the Analytical Queries (OLAP) tool tap the Map button at the center of the page top panel.
In the Dashboards tool:
Tap the map title.
Go to the full-screen mode of blocks and select a block with the map.
A map is available if:
A data source contains a territory dimension.
A topobase is included into express report or dashboard.
A topobase is exported on report publication.
NOTE. If the above mentioned conditions are not observed, a map cannot be displayed.

To work with dimensions, use the Layout panel at the left page edge.
Foresight Analytics Platform maps and Apple maps can be used. The following map parameters can be determined by values of the elements selected in metrics dimension:
Territory fill color or bubble color (for Apple maps).
Territory height (in 3D view) or bubble color (for Apple maps).
Bar and pie microcharts (only for Foresight Analytics Platform maps).
Width and color of arrows (only for Foresight Analytics Platform maps).
Territory drill down on a map is available if it is set up in the desktop application.
TIP. To further work with a map at the application level, use the Map component.
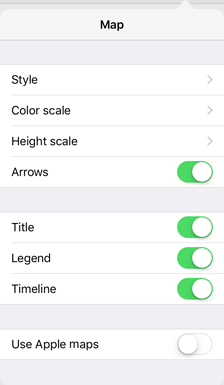
To set up map parameters, tap the  button at the top right corner of the express report or dashboard page.
After executing the operation the Map dialog box opens:

A map can also be displayed in 3D mode and as microcharts.
Maps can be resized, rotated and moved using gestures:
To zoom in and out a map, use two-finger pinch.
To zoom in a map, double tap it.
To move a map, swipe to left or to right.
The rotate a map, use two-finger rotation.
See also: