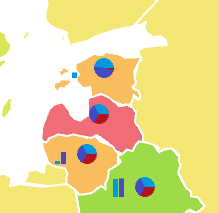
Microcharts enable the user to show additional territory info on a map. Microcharts are displayed only for maps of Foresight Analytics Platform.
Microcharts can be bar and pie ones. On tapping the microchart, a tooltip with information on each selected metric appears.
To display microcharts:
Set up metrics dimension.
Map dimension elements and map characteristics:
Bar Metric. Select a metric for the dimension elements, by which values bars are built. A separate bar is displayed for each element.
Pie Metric. Select a metric for the dimension elements, by which pie microchart sectors are built. A separate sector is displayed for each element.
Several dimension elements with the Metrics role can be set for map characteristic.
Example of showing microcharts:

See also: