
Visualizers enable the user to display data from a source in different forms, allow for quick creation of reports that are used to analyze ad-hoc data dimensions.
NOTE. Data visualizers are available in the tools: Analytical Queries (OLAP), Dashboards. In dashboards, visualizers can use data from several sources.
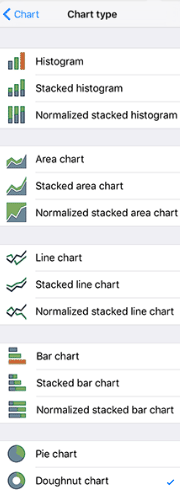
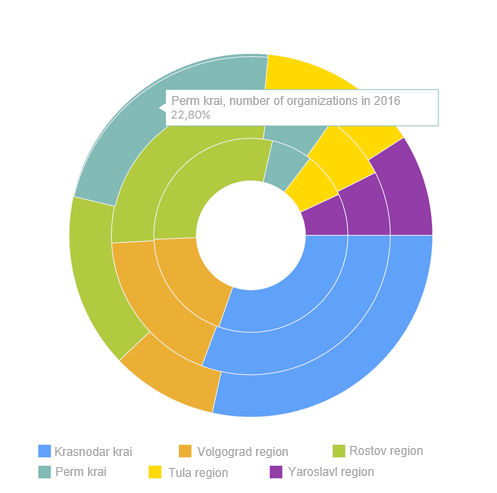
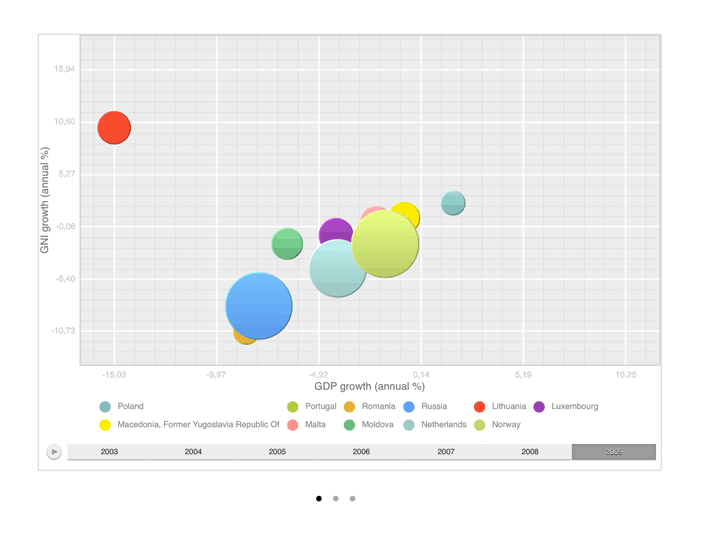
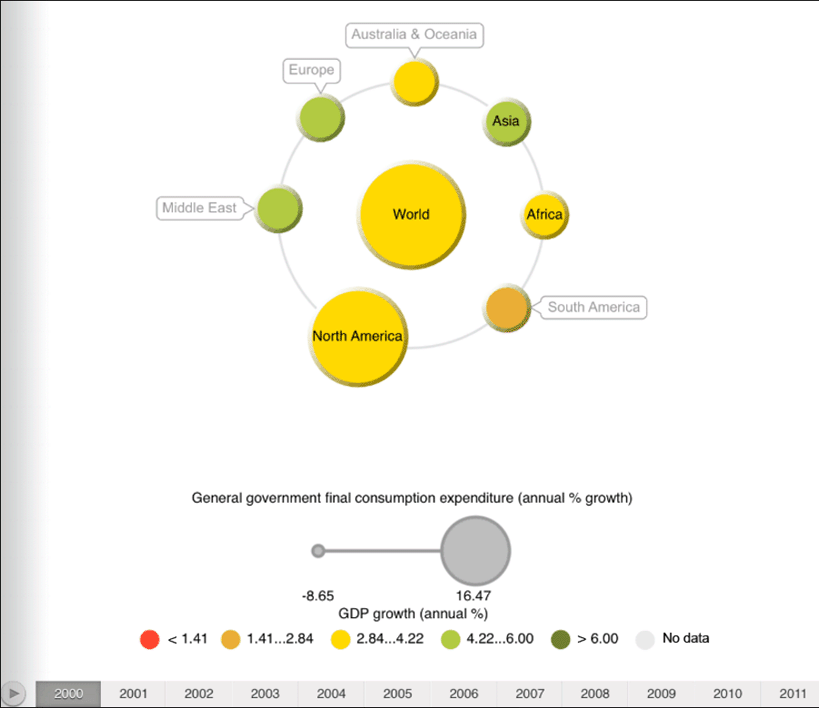
Available data visualizers:

Map:

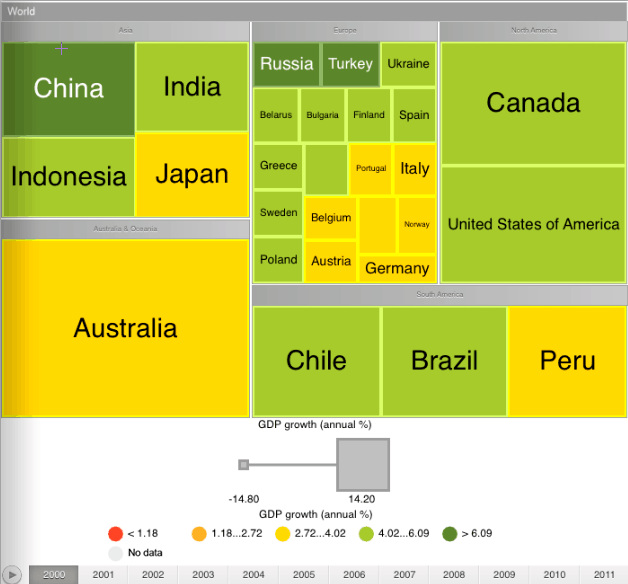
See general visualizer settings in the Setting Up Visualizers article.
See also:
Table | Chart | Map | Bubble Chart | Bubble Tree | Tree Map | Setting Up Visualizers