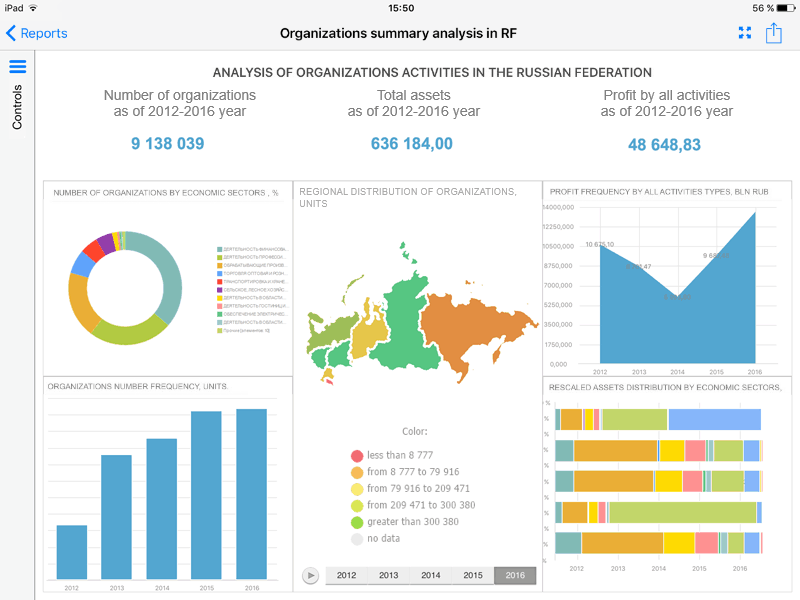
To work with dashboards, use the Dashboards tool:

The Dashboards tool in the mobile application enables the user to view analytical documents created in the desktop application as a combination of interactive interrelated visualizers.
Key features:
Interchangeable visualizers: tables, charts, maps, and so on.
Working according to the WYSIWYG principle (What You SeeIs What You Get), that is, the user sees at once how a dashboard looks like.
Using objects from other tools without applying additional settings.
To get started with dashboards in the mobile application, see the Getting Started with the Dashboards Tool section.
To change dimension selection, see the Changing Dimension Selection article.
To work with data visualizers, see the Working with Data Visualizers article.
See also: