 button at the top right corner of the page. The dialog box opens where the user can set up the current visualizer parameters.
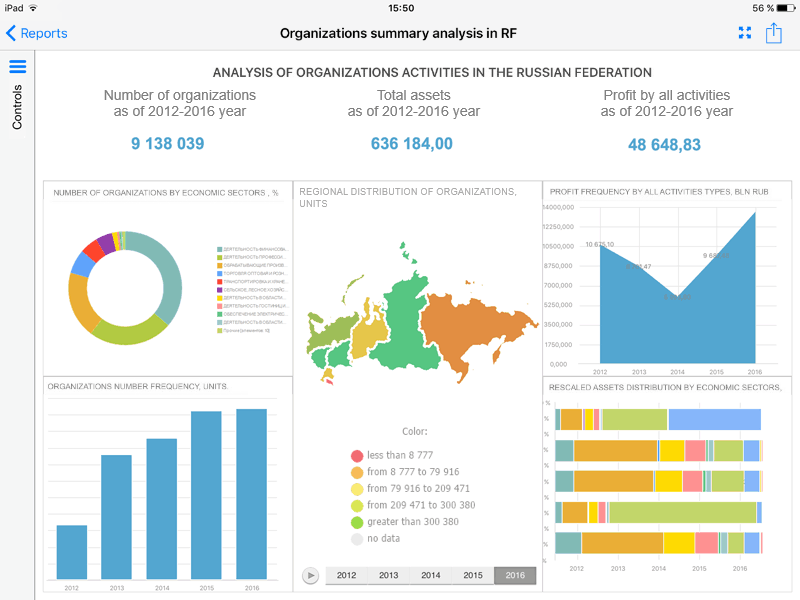
Dashboards are used to display information from sources with the ability to analyze and set up the displayed data by means of visualizers:
Map.
To set up current data visualizer parameters, tap the  button at the top right corner of the page. The dialog box opens where the user can set up the current visualizer parameters.
Seegeneral visualizer settings in the Setting Up Visualizers article.
Dashboards in the mobile application also enable the user to work with the following blocks:
The Express Report report. Only active express report visualizer is available.
The Dashboard report. Report viewing and executing basic operations are available, for example, discussing report by email.
To open one block in the full-screen mode, tap its title or tap the  button:

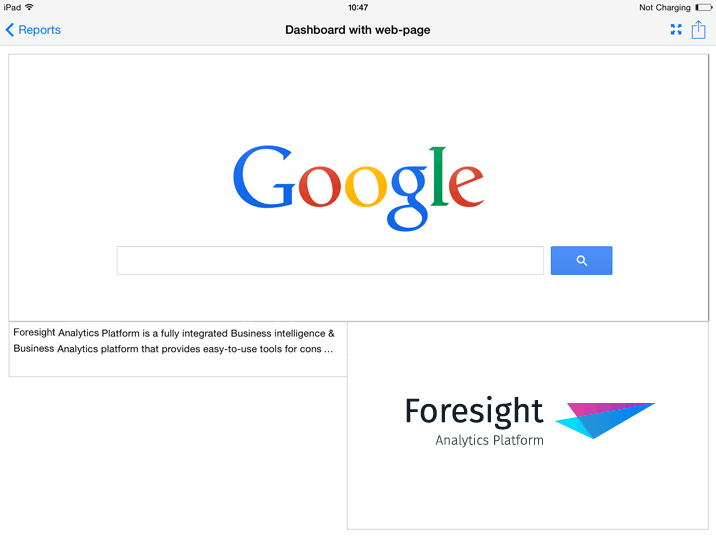
The mobile application allows information to be presented in text, picture and HTML formats, if this option is set in the source dashboard.
The example of a dashboard with text, picture and HTML page:

Other multimedia effects can be supported at the application level.
See also:
Table | Chart | Map | Bubble Chart | Bubble Tree | Tree Map | Setting Up Visualizers