Tap the  button at the top right corner of the express report page.
In the Table dialog box that opens enable the switch button next to the Growth Indicators item.
Growth indicators display how a cell value changes against other values.
To display growth indicators in the entire table:
Tap the  button at the top right corner of the express report page.
In the Table dialog box that opens enable the switch button next to the Growth Indicators item.
To display growth indicators for a single column or row:
Tap the row or column header.
Enable the Growth Indicators switch button in the dialog box that opens.
To hide growth indicators, change the switch button position.
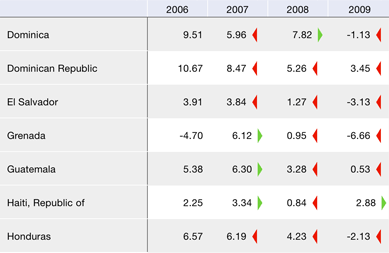
Example of displaying growth indicator for rows:

The green arrow shows that the cell value is greater than the value in the left cell. The red arrow shows that the cell value is less than the value in the left cell.
See also: