General Settings
To set up chart view, stacking type, background fill and border, use the General Settings group of parameters on the side panel.
 Open the General Settings group of parameters

 Parameters button on the toolbar, then select the required group.
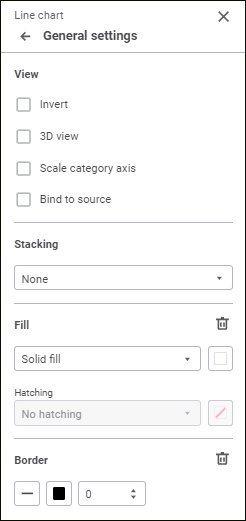
Set the parameters:
View
To set up chart view, set:
Invert. Select the checkbox to change scale orientation, in this case the X axis will be oriented bottom to top, and the Y axis will be oriented left to right. The order of series displaying in the legend will also be inverted. When the checkbox is selected, scale orientation and series order in the legend will be restored to the original.
NOTE. It is available only for the following chart types: line charts, mixed charts, scatter charts, box charts, waterfall charts, stepped charts, histograms, area charts, and box charts with linear series.
3D View. Select the checkbox to display 3D chart.
NOTE. It is available only for the following chart types: line charts, pie charts, mixed charts, histograms, and area charts.
Scale Category Axis. To change chart scale using the scroller, select the Scale Category Axis checkbox.
NOTE. It is available only for the following chart types: line charts, mixed charts, waterfall charts, stepped charts, histograms, and area charts.
After the checkbox is selected, the scroller will be displayed below the chart area.
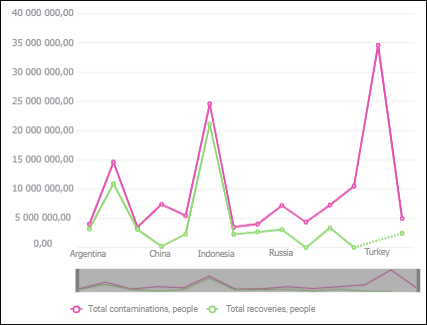
To zoom, point the cursor to the scroller border. The pointer changes to the two-headed arrow:

Click the scroller border and drag it. The chart is automatically rebuilt. The chart plot area will show the part corresponding to the scroller part:
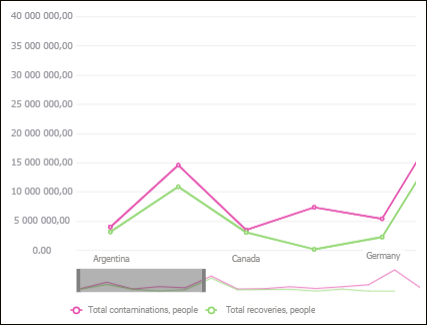
To move the scroller, point the mouse pointer to it. The pointer changes to the four-headed arrow:

Click and hold down the mouse button to move the scroller part to the required position. The plot area will show the corresponding chart part.
To quick zoom, put the mouse pointer to the scroller or the chart area and scroll up the mouse wheel to zoom in and scroll down to zoom out.
To restore the chart to its original appearance, execute one of the operations:
Deselect the Zoom Category Axis checkbox.
Move scroller borders to initial position.
Bind to Source. To save chart data series formatting, select the Bind to Source checkbox. After the checkbox is selected, data series formatting will not change in case of dimension selection changes. When working with mixed charts, linear series are brought to front relative to the other series types.
NOTE. It is available if a chart is built based on a data slice.
Stacking
Select the stacking type in use in the drop-down list:
None. A chart shows absolute values of a series.
Absolute. A chart shows values with stacking allowing to assess part of each value in the total sum.
Percent. A chart shows values as percentage allowing to assess part of each value in the total sum.
NOTE. It is available for series of the following chart types: line charts, mixed charts, histograms, and area charts.
Fill
To set up chart background, select fill type in the drop-down list:
No Fill. Default value. Fill is not used.
Solid Fill. Select solid fill color in the drop-down palette. If required, specify fill opacity percent.
Two-Color Fill. Select start and end gradient colors in the drop-down palette. If required, specify tilt angle and fill opacity percent.
Hatching Fill. Execute the operations:
Select solid fill color in the drop-down palette. If required, specify fill color and hatching color transparency percent.
Select texture option in the Hatching drop-down list.
Select hatching color in the drop-down color palette.
The drop-down palette can be used to select standard and custom colors. The palette contains only standard colors by default.
To create a custom color:
Click the
 Add Color button. The advanced color palette opens:
Select a color in the advanced color palette, use color picker to select color on a browser page, or set color code in the RGB or HEX format.
After executing the operations the custom color is created and added to the palette.
NOTE. The maximum possible number of custom colors in the a palette is 23.
To delete custom color from the palette, select the Delete item in the selected color's context menu.
To reset fill settings, click the  Delete button.
Border
To set up chart border, set:
Line Type. Select line type in the drop-down list.
Line Color. Select line color in the drop-down palette. One can select standard and custom colors. The palette contains only standard colors by default.
To create a custom color:
Click the
Add Color button. The advanced color palette opens.
Select a color in the advanced color palette, use color picker to select color on a browser page, or set color code in the RGB or HEX format.
After executing the operations the custom color is created and added to the palette.
NOTE. The maximum possible number of custom colors in the a palette is 23.
To delete custom color from the palette, select the Delete item in the selected color's context menu.
Line Width. Set the required line width using the keyboard or the value editor.
To reset birder settings, click the Delete button.